

The sample mean is a crucial concept in statistics. It helps us understand data from a smaller group. We use it to make inferences about a larger population.
This is particularly useful when studying large populations. It is impractical to collect data from every individual. Instead, we select a smaller group, a sample. We then calculate the sample mean to estimate the population mean.
Table of contents
What is a Sample Mean?
The sample mean is the average of a set of data points. We calculate it by adding all the values and dividing by the number of values. It is represented by the symbol x̄ (pronounced “x-bar”).
It provides a snapshot of the central tendency of a dataset, essentially telling us where the “middle” of the data lies. Imagine you have a basket of apples, each with a different weight. The sample mean would be the average weight of those apples, giving you a single number that represents the overall weight distribution.
More formally, the sample mean is calculated by summing all the values in a sample and dividing by the number of observations in that sample. It’s a fundamental concept used to estimate the mean of a larger population from which the sample is drawn.
Formula
The formula for calculating the sample mean is:
x̄ = ( Σ xi ) / n
Where:
- x̄ represents the sample mean
- Σ xi represents the sum of all data points in the sample
- n represents the number of data points in the sample
Steps to Calculate the Sample Mean
- Collect data: Gather the data points for your sample.
- Add the values: Sum all the data points in your sample.
- Divide by the count: Divide the sum by the number of data points in your sample.
Example Calculation
Let’s say we have a sample of five students’ test scores: 80, 85, 90, 95, and 100.
Add the values: 80 + 85 + 90 + 95 + 100 = 450
Divide by the count: 450 / 5 = 90
Therefore, the sample mean of these test scores is 90.
Why is the Sample Mean Important?
The sample mean is important because it provides a representative value for the sample data. We can use it to make inferences about the larger population. For example, if the sample mean of the students’ test scores is 90, we can infer that the average test score for the entire class is likely around 90.
The importance of the sample mean stems from its ability to provide a representative value for a dataset. It allows us to:

- Estimate the Population Mean: In many cases, collecting data from an entire population is impractical or impossible. The sample mean provides a reliable estimate of the population mean, allowing us to make inferences about the larger group.
- Compare Different Groups: The sample mean enables us to compare different groups or datasets. For example, we can compare the average test scores of two different classes to see which class performed better.
- Track Changes Over Time: By calculating the sample mean at different points in time, we can track changes or trends in a dataset. This is useful for monitoring things like customer satisfaction, employee performance, or economic indicators.
- Make Informed Decisions: The sample mean provides valuable information that can be used to make informed decisions. For example, a business might use the sample mean to estimate customer demand for a new product.
Factors Influencing the Accuracy of the Sample Mean
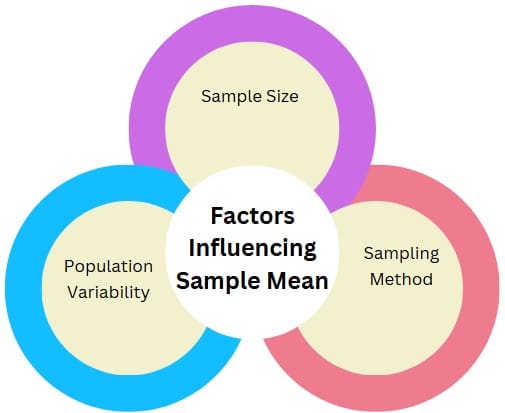
Several factors can affect how accurately the sample mean reflects the population mean:
- Sample Size: Generally, the larger the sample size, the more accurate the estimate of the population mean. A larger sample is more likely to capture the variability within the population.
- Sampling Method: The method used to select the sample is crucial. Random sampling, where every member of the population has an equal chance of being selected, helps ensure a representative sample and a more accurate sample mean.
- Population Variability: If the population is highly variable, meaning the data points are spread out over a wide range, the sample mean may be less accurate. Conversely, if the population is relatively homogeneous, the sample mean will be a more precise estimate.
Also See: Lean Six Sigma Certification Programs, Fremont, California
Sample Mean vs. Population Mean
It’s important to distinguish between the sample mean and the population mean. The population mean is the average of all the values in the entire population. It is represented by the symbol μ (pronounced “mu”).
The sample mean is an estimate of the population mean. It is based on a smaller subset of the population. The accuracy of the sample mean as an estimate of the population mean depends on how representative the sample is of the population.
| Feature | Population Mean | Sample Mean |
| Definition | The average of all values in the entire population. | The average of all values in a sample of the population. |
| Symbol | μ (mu) | x̄ (x-bar) |
| Calculation | The sum of all values in the sample divided by the sample size. | Sum of all values in the sample divided by the sample size. |
| Purpose | Represents the true average of the entire population. | Estimates the population mean. |
| Data Required | Data from every individual in the population. | Data from a subset of the population. |
| Feasibility | Often difficult or impossible to obtain for large populations. | Easier and more practical to obtain. |
| Accuracy | Provides the exact average value. | Provides an estimate with some degree of error. |
| Affected by | All values in the population. | Only the values in the sample. |
Applications
The sample mean has numerous applications in various fields, including:
- Business: Businesses use the sample mean to estimate customer satisfaction, market demand, and sales trends.
- Healthcare: Healthcare professionals use the sample mean to track patient outcomes, assess the effectiveness of treatments, and monitor disease prevalence.
- Education: Educators use the sample mean to track student performance, evaluate teaching methods, and assess the effectiveness of educational programs.
- Social sciences: Social scientists use the sample means to study human behavior, attitudes, and opinions.
Advantages
- Efficiency: It is often more efficient to collect data from a sample than from the entire population.
- Cost-effectiveness: Sampling can be more cost-effective than collecting data from the entire population.
- Practicality: In many cases, it is impractical or impossible to collect data from the entire population.
Limitations
- Sampling error: The sample mean is only an estimate of the population mean, and there is always some degree of error associated with it.
- Bias: If the sample is not representative of the population, the sample mean may be biased.
- Limited information: The sample mean provides limited information about the distribution of the data.
Final Words
The sample mean is a fundamental concept in statistics, providing a valuable tool for understanding data and making informed decisions. It allows us to estimate population characteristics, compare different groups, track changes over time, and gain insights into various phenomena.
While the sample mean has limitations, its efficiency, cost-effectiveness, and practicality make it an indispensable tool for researchers, analysts, and decision-makers across a wide range of disciplines. By understanding the sample mean and its nuances, we can unlock the power of data and gain a deeper understanding of the world around us.

About Six Sigma Development Solutions, Inc.
Six Sigma Development Solutions, Inc. offers onsite, public, and virtual Lean Six Sigma certification training. We are an Accredited Training Organization by the IASSC (International Association of Six Sigma Certification). We offer Lean Six Sigma Green Belt, Black Belt, and Yellow Belt, as well as LEAN certifications.
Book a Call and Let us know how we can help meet your training needs.


