
Weibull analysis is a statistical method designed to analyze life-data, particularly failure times of products or systems. It helps engineers and analysts uncover patterns in failure behavior, predict product reliability, and make smart maintenance decisions. The technique hinges on the Weibull distribution, a powerful continuous probability model used widely in reliability engineering, survival analysis, and risk assessment.
This article delves deep into the concept of Weibull analysis, explaining its purpose, formulas, practical applications, and how to perform it using tools like Excel. Whether you are a quality engineer, data analyst, or just curious about failure data modeling, this comprehensive guide brings clarity and simplicity to Weibull analysis.
Table of contents
What is Weibull Analysis?
Weibull analysis statistically models the time until a product or component fails. Named after Swedish mathematician Waloddi Weibull, this method fits a Weibull distribution curve to life data, such as time-to-failure or time-between-failures. It reveals the underlying failure patterns and enables predictions about future reliability.
At its core, Weibull analysis answers key questions: How long will a product last? What type of failure behavior does it show? When do failures tend to occur during the product lifecycle? The method accommodates various failure modes ranging from early defects to constant failure rates and wear-out failures.
Understanding the Weibull Distribution
Weibull distribution is a versatile probability model characterized by its:
- Shape parameter (β): Defines the failure rate pattern. A shape less than 1 indicates decreasing failure rate (early failures), equal to 1 indicates constant failure rate (random failures), and greater than 1 means increasing failure rate (wear-out failures).
- Scale parameter (η): Represents the characteristic life, the point by which 63.2% of units have failed.
- Location parameter (γ): Sometimes included to shift the distribution along the timeline, useful in 3-parameter models.
Mathematically, the probability density function of a 2-parameter Weibull distribution is:
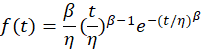
where is time,
the shape, and
the scale.
This distribution is especially noted for its flexibility in modeling heavy-tailed data and extreme value distribution cases often seen in failure data.

Public, Onsite, Virtual, and Online Six Sigma Certification Training!
- We are accredited by the IASSC.
- Live Public Training at 52 Sites.
- Live Virtual Training.
- Onsite Training (at your organization).
- Interactive Online (self-paced) training,
Why Use Weibull Analysis?
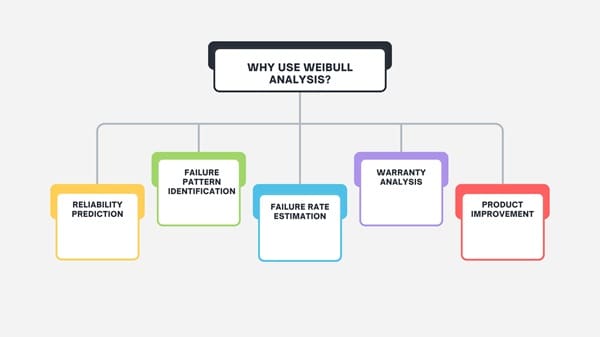
Weibull analysis provides valuable insights such as:
- Reliability prediction: Estimating the probability a product lasts beyond a certain time.
- Failure pattern identification: Understanding if failures are due to early defects, random incidents, or aging.
- Failure rate estimation: Calculating the hazard function, or instantaneous failure rate, helps set maintenance schedules.
- Warranty analysis: Designing warranty periods aligned with realistic product lifetime.
- Product improvement: Highlighting weaknesses by separating infant mortality failures from wear-out issues.
Also Read: Bow-tie Analysis
Core Components of Weibull Analysis
Weibull Plot
A Weibull plot is a graphical technique that transforms the Weibull cumulative distribution function to a linear form. Plotting data on logarithmic scales allows easy estimation of shape and scale parameters from the slope and intercept of the best-fit line. The plot helps validate whether Weibull is a suitable model for the failure data.
Weibull Parameters Estimation
Parameter estimation can be done through:
- Graphical methods (Weibull plot)
- Maximum likelihood estimation (MLE): A more precise statistical method often used in software tools.
- Least squares estimation: Fitting the linearized form to data points.
Accurate estimation is crucial for meaningful reliability predictions.
Weibull Hazard Function
The hazard function describes the failure rate at any given time. It takes the form:
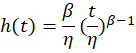
This function is instrumental in understanding whether failures are increasing or decreasing over time.
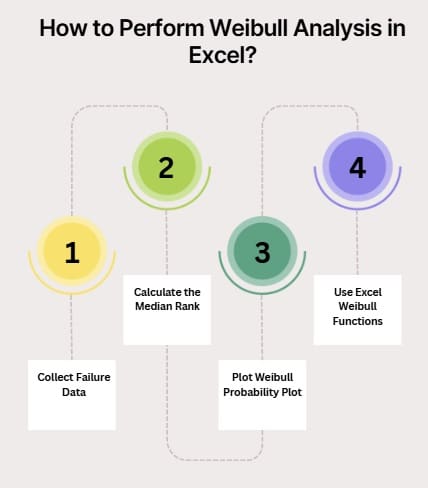
How to Perform Weibull Analysis in Excel?
Excel supports Weibull analysis through built-in functions and add-ins, making it accessible even without specialized software.
Step 1: Collect Failure Data
List failure times chronologically. For right-censored data (items not failed yet), note these as censored.
Step 2: Calculate the Median Rank
Median rank estimates the cumulative failure probability for each failure instance. It can be calculated using formulas like:
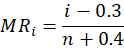
where is the failure rank and
the total number of failures.
Step 3: Plot Weibull Probability Plot
Using calculated median ranks and failure times, plot a Weibull probability plot by:
- Transforming the axes (log-log scale)
- Adding a trendline to estimate parameters
Step 4: Use Excel Weibull Functions
The function WEIBULL.DIST(x, alpha, beta, cumulative) calculates the Weibull distribution value.
Example: To find the probability of failure by time , use:

Practical Applications of Weibull Analysis
- Manufacturing: Assess product durability and identify early failures.
- Electronics: Predict mean time to failure for components.
- Automotive: Determine warranty limits and maintenance intervals.
- Healthcare: Model patient survival times using Weibull survival models.
- Weather forecasting: Model extreme value distributions like maximum daily rainfall.
Related Concepts and Tools
- Generalized extreme value distribution: Extends Weibull to broader datasets.
- Heavy tail distribution: Related to Weibull’s ability to model rare but extreme failure times.
- Weibull regression: Used in survival analysis to evaluate covariates influencing failure.
- Weibull survival function: Calculates the probability a unit survives beyond time
.
Also Read: Stakeholder Analysis Matrix
Frequently Asked Questions (FAQs)
What is Weibull analysis used for?
Weibull analysis is used to model life data, analyze failure behavior, and predict product reliability to support maintenance and warranty decisions.
How is the Weibull distribution different from other distributions?
It is highly flexible with its shape parameter, capable of modeling increasing, decreasing, or constant failure rates, unlike fixed-rate models.
Can I perform Weibull analysis in Excel?
Yes, Excel offers built-in functions and tools like WEIBULL.DIST to perform basic Weibull analysis and generate probability plots.
What does the shape parameter β indicate?
It shows failure rate behavior: less than 1 indicates early failures, equal to 1 means random failures, and greater than 1 points to wear-out failures.
Is Weibull analysis applicable outside engineering?
Absolutely, it is also used in medical survival analysis, weather forecasting, finance, and anywhere modeling of time-to-event is needed.
Final Words
Weibull analysis stands out as a fundamental statistical technique in understanding product lifetimes and failure patterns. Its flexibility through the shape and scale parameters makes it suitable for diverse applications, from industrial manufacturing to healthcare. By mastering Weibull analysis and its related tools, professionals can make data-driven decisions that improve reliability, optimize maintenance, and ultimately deliver better products to market.

About Six Sigma Development Solutions, Inc.
Six Sigma Development Solutions, Inc. offers onsite, public, and virtual Lean Six Sigma certification training. We are an Accredited Training Organization by the IASSC (International Association of Six Sigma Certification). We offer Lean Six Sigma Green Belt, Black Belt, and Yellow Belt, as well as LEAN certifications.
Book a Call and Let us know how we can help meet your training needs.


