Pooled standard deviation serves as a crucial statistical measure that combines the variability from multiple samples into a single estimate. When researchers need to compare two or more groups, they often require a common measure of spread that represents the overall variation across all samples.
This statistical technique becomes particularly valuable when analyzing experimental data where multiple groups share similar characteristics but may have different sample sizes. The pooled approach provides a more reliable estimate of the population standard deviation by leveraging information from all available samples.
Table of contents
- What is Pooled Standard Deviation?
- Understanding Pooled Variance
- Pooled Standard Deviation Formula
- How to Calculate Pooled Standard Deviation: Step-by-Step Guide
- Pooled Standard Error and Its Applications
- Advanced Applications and Considerations
- Comparing Pooled vs. Unpooled Methods
- Frequently Asked Questions
- Related Articles
What is Pooled Standard Deviation?
Pooled standard deviation is a way to estimate the overall variability (spread) of data when you have two or more groups of measurements that you want to combine into a single estimate. It’s especially useful in situations where you believe the groups have similar variability, but you want to use all the data together to get a more reliable measure of how spread out the values are.
In your own words, you can think of pooled standard deviation as a “weighted average” of the standard deviations from different groups, where each group’s standard deviation is adjusted for the number of observations in that group. This gives you a single value that represents the overall spread of the combined data set, taking into account both the differences within each group and the number of data points in each group.
Public, Onsite, Virtual, and Online Six Sigma Certification Training!
- We are accredited by the IASSC.
- Live Public Training at 52 Sites.
- Live Virtual Training.
- Onsite Training (at your organization).
- Interactive Online (self-paced) training,
Understanding Pooled Variance
Before diving into pooled standard deviation, understanding pooled variance proves essential. Pooled variance represents the weighted average of individual sample variances, where the weights correspond to the degrees of freedom for each sample.
The concept of pooled variance emerges from the assumption that all samples come from populations with identical variances. Consequently, combining these individual estimates creates a more precise overall estimate of the common population variance.
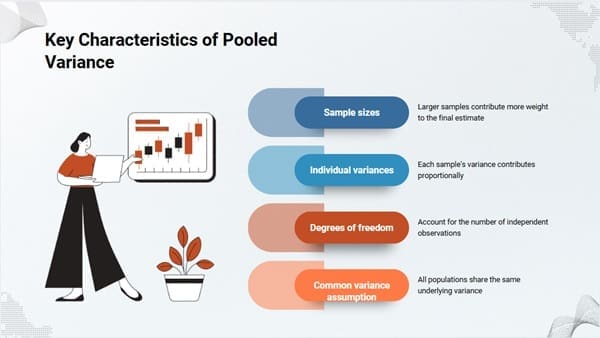
Key Characteristics of Pooled Variance

The pooled variance calculation incorporates several important elements:
- Sample sizes: Larger samples contribute more weight to the final estimate
- Individual variances: Each sample’s variance contributes proportionally
- Degrees of freedom: Account for the number of independent observations
- Common variance assumption: All populations share the same underlying variance
Also Read: Difference Between Standard Deviation and Standard Error
Pooled Standard Deviation Formula
The pooled standard deviation formula builds directly upon the pooled variance calculation. Here’s the complete mathematical framework:
Step 1: Calculate Pooled Variance
The pooled variance formula for two samples is:
s²pooled = [(n₁ – 1)s₁² + (n₂ – 1)s₂²] / (n₁ + n₂ – 2)
Where:
- s²pooled = pooled variance
- n₁, n₂ = sample sizes for groups 1 and 2
- s₁², s₂² = sample variances for groups 1 and 2
Step 2: Calculate Pooled Standard Deviation
The pooled standard deviation is simply the square root of the pooled variance:
spooled = √s²pooled
Extended Formula for Multiple Samples
When working with more than two samples, the formula expands:
s²pooled = Σ[(ni – 1)si²] / Σ(ni – 1)
This notation represents the sum of weighted variances divided by the total degrees of freedom.
How to Calculate Pooled Standard Deviation: Step-by-Step Guide

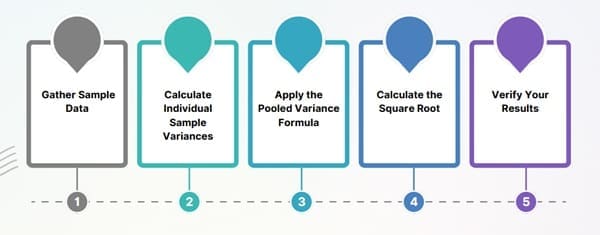
Follow these systematic steps to calculate pooled standard deviation accurately:
Step 1: Gather Sample Data
Collect all necessary information including sample sizes, means, and standard deviations for each group.
Step 2: Calculate Individual Sample Variances
If you have standard deviations, square them to obtain variances. If you have raw data, calculate the sample variance for each group.
Step 3: Apply the Pooled Variance Formula
Substitute your values into the pooled variance equation, ensuring proper weighting by degrees of freedom.
Step 4: Calculate the Square Root
Take the square root of the pooled variance to obtain the pooled standard deviation.
Step 5: Verify Your Results
Double-check calculations and ensure the pooled standard deviation falls within a reasonable range compared to individual sample standard deviations.
Practical Example
Let’s work through a concrete example to illustrate the calculation process.
Scenario: A researcher compares test scores between two teaching methods.
- Group 1 (Traditional method): n₁ = 20, s₁ = 12.5
- Group 2 (New method): n₂ = 25, s₂ = 15.2
Step 1: Calculate sample variances
- s₁² = 12.5² = 156.25
- s₂² = 15.2² = 231.04
Step 2: Apply pooled variance formula s²pooled = [(20-1)(156.25) + (25-1)(231.04)] / (20+25-2) s²pooled = [19(156.25) + 24(231.04)] / 43 s²pooled = [2,968.75 + 5,544.96] / 43 s²pooled = 8,513.71 / 43 = 197.99
Step 3: Calculate pooled standard deviation spooled = √197.99 = 14.07
Therefore, the pooled standard deviation equals 14.07, representing the combined variability across both teaching methods.
When to Use Pooled Standard Deviation?

Understanding when to apply pooled standard deviation ensures appropriate statistical analysis. Consider using this approach in the following situations:
Equal Variance Assumption
The most critical requirement involves assuming that all populations have equal variances. Statistical tests like Levene’s test can help verify this assumption before proceeding with pooled calculations.
Independent Samples T-Test
The pooled t-test relies heavily on pooled standard deviation when comparing means between two independent groups. This approach provides more statistical power when the equal variance assumption holds.
ANOVA Procedures
Analysis of variance (ANOVA) techniques often utilize pooled variance estimates to assess differences among multiple group means simultaneously.
Small Sample Sizes
When individual sample sizes are small, pooling information across groups can provide more stable variance estimates compared to individual sample variances.
Also Read: What is F-ratio?
Pooled Standard Error and Its Applications
The pooled standard error builds upon the pooled standard deviation concept, specifically addressing the precision of mean differences between groups.
Formula of Pooled Standard Error
For comparing two means, the pooled standard error formula is:
SEpooled = spooled × √(1/n₁ + 1/n₂)
This formula accounts for both the pooled variability and the sample sizes when estimating the standard error of the difference between means.
Applications in Hypothesis Testing
The pooled standard error plays a crucial role in constructing confidence intervals and conducting hypothesis tests for mean differences. It provides the denominator for t-statistics in pooled t-tests, enabling researchers to determine statistical significance.
Pooled Standard Deviation in Excel
Microsoft Excel offers several approaches for calculating pooled standard deviation, ranging from manual formula entry to built-in statistical functions.
Manual Calculation Method
- Enter your sample data in separate columns
- Calculate individual sample variances using the VAR.S function
- Apply the pooled variance formula using cell references
- Use the SQRT function to obtain the pooled standard deviation
Using Excel’s T-Test Functions
Excel’s T.TEST function automatically calculates pooled standard deviation when you specify the equal variance assumption (type 2 for two-sample equal variance).
Common Mistakes and How to Avoid Them
Several pitfalls can compromise pooled standard deviation calculations:
Violating the Equal Variance Assumption
Always test for equal variances before pooling. If this assumption fails, consider alternative approaches like Welch’s t-test.
Incorrect Degrees of Freedom
Remember that degrees of freedom equal the sum of individual sample sizes minus the number of groups, not the total sample size minus one.
Mixing Population and Sample Statistics
Ensure consistency in using either population or sample variance formulas throughout your calculations.
Calculator Errors
Double-check all arithmetic operations, particularly when dealing with squared terms and square roots.
Advanced Applications and Considerations
Pooled Variance in Regression Analysis
Multiple regression models often assume homoscedasticity (equal variances), making pooled variance concepts relevant for error term analysis and residual diagnostics.
Bayesian Approaches
Modern statistical methods sometimes incorporate pooled variance concepts within Bayesian frameworks, allowing for more flexible modeling of variance structures.
Meta-Analysis Applications
When combining results from multiple studies, researchers frequently use pooled variance techniques to synthesize effect sizes and confidence intervals.
Comparing Pooled vs. Unpooled Methods
Understanding when to choose between pooled and unpooled approaches requires careful consideration of underlying assumptions and data characteristics.
Advantages of Pooled Methods
- Increased statistical power
- More stable variance estimates
- Simplified interpretation
Disadvantages of Pooled Methods
- Restrictive equal variance assumption
- Potential bias when assumption fails
- May obscure important group differences
Quality Control and Validation
Diagnostic Checks
Always perform diagnostic checks to validate the appropriateness of pooled standard deviation:
- Test for equal variances using formal statistical tests
- Examine residual plots for patterns
- Consider the practical significance of any variance differences
Sensitivity Analysis
Conduct sensitivity analyses to assess how violations of assumptions might affect your conclusions.
Frequently Asked Questions
What is the difference between pooled standard deviation and regular standard deviation?
Pooled standard deviation combines information from multiple samples to create a single estimate of variability, assuming all samples come from populations with equal variances. Regular standard deviation measures variability within a single sample.
When should I use pooled variance in a t-test?
Use pooled variance when conducting a two-sample t-test and you can reasonably assume that both populations have equal variances. This assumption can be tested using statistical tests like Levene’s test or by examining the ratio of sample variances.
How do I know if the equal variance assumption is violated?
Test the equal variance assumption using formal statistical tests (Levene’s test, Bartlett’s test) or examine the ratio of sample variances. If the larger variance is more than 2-3 times the smaller variance, consider using unpooled methods.
Can I calculate pooled standard deviation for more than two groups?
Yes, the pooled standard deviation formula extends to multiple groups by summing the weighted variances across all groups and dividing by the total degrees of freedom.
What does the pooled standard deviation symbol represent?
The pooled standard deviation is typically represented as spooled or sp, indicating that it combines information from multiple samples rather than representing a single sample.


