
Mode in statistics represents the value that appears most frequently in a data set. This fundamental measure of central tendency helps identify the most common occurrence within numerical collections. In statistics, the mode is the value that appears most often in a set of data values, making it essential for understanding data patterns.
The mode definition encompasses any value with the highest frequency of occurrence. Unlike mean and median calculations, mode identification requires counting frequencies rather than mathematical computation. This characteristic makes mode particularly useful for categorical data analysis.
Furthermore, mode serves as one of three primary measures of central tendency. While mean calculates average values and median finds middle positions, mode reveals which values occur most frequently. This distinction makes mode especially valuable for understanding distribution characteristics.
Additionally, mode is the data point that comes the most frequently among a group of data members, providing insights into typical or expected values within datasets.
Table of contents
What Is the Mode in Statistics?
The mode in statistics is the value that appears most frequently in a dataset. It serves as a key measure of central tendency, highlighting the most common number or category. Unlike complex calculations required for mean or median, the mode is straightforward, making it accessible for beginners.
For example, in the dataset {3, 5, 5, 7, 9}, the mode is 5 because it appears twice. This guide provides a detailed exploration of the mode’s definition, its applications, and its significance in data analysis.

Public, Onsite, Virtual, and Online Six Sigma Certification Training!
- We are accredited by the IASSC.
- Live Public Training at 52 Sites.
- Live Virtual Training.
- Onsite Training (at your organization).
- Interactive Online (self-paced) training,
Meaning in Math
The mode meaning in math extends beyond simple frequency counting to represent typical behavior patterns. In mathematical contexts, mode identifies peak values in probability distributions and frequency histograms. This statistical concept helps researchers understand which outcomes occur most commonly.
Moreover, mode definition math encompasses both discrete and continuous data applications. For discrete data, mode represents exact values with highest frequencies. For continuous data, modal classes or intervals contain the most observations.
The meaning of mode in math also includes identifying distribution shapes. Unimodal distributions have single peaks, while bimodal distributions show two distinct modes. These patterns reveal underlying data characteristics and population structures.
Statistics Applications
Mode statistics find applications across numerous fields and research areas. Market researchers use mode to identify most popular products or preferences. Healthcare professionals apply mode to determine common symptoms or treatment outcomes.
Educational assessments frequently employ mode to understand typical student performance levels. Manufacturing quality control uses mode to identify most frequent defect types or measurement values. These applications demonstrate mode’s practical importance.
Furthermore, mode analytics help businesses understand customer behavior patterns. Social media platforms use mode to identify trending topics or engagement patterns. These insights drive decision-making and strategic planning processes.
Basic Mode Calculation
Calculating mode requires systematic frequency counting and comparison. First, arrange data values in ascending or descending order for easier analysis. Next, count how many times each value appears in the dataset.
Then, identify the value with the highest frequency count. This value represents the mode of the data set. If multiple values share the highest frequency, the dataset becomes multimodal with multiple modes.
For example, in the dataset {3, 5, 7, 5, 9, 5, 3}, the value 5 appears three times while others appear less frequently. Therefore, 5 is the mode of this dataset.
Role in Math and Statistics
In descriptive statistics, the mode is one of three primary measures of central tendency, alongside mean and median. It identifies the value with the highest frequency, offering insights into data patterns. For instance, in a set like {1, 2, 2, 3, 4}, the mode is 2.
Unlike mean, which averages values, or median, which finds the middle, the mode focuses solely on frequency. Moreover, datasets can have one mode, multiple modes, or none, adding flexibility. This unique characteristic makes the mode invaluable in both math and statistics.
Why the Mode Is Essential?
The mode plays a critical role in data analysis. It quickly identifies the most frequent values, revealing trends without complex math. Businesses rely on it to understand customer preferences, such as popular product sizes. Additionally, the mode applies to non-numerical data, like survey responses, making it versatile.
For example, in a survey of favorite colors, if “blue” appears most, it’s the mode. In 2025, as data-driven decisions dominate, the mode remains a vital tool for actionable insights.
Also Read: Arithmetic Mean: Guide to Understanding and Calculating Averages
Types of Modes in Datasets

Datasets exhibit different modal behaviors, each offering unique insights. Understanding these types enhances data interpretation.
Unimodal Datasets
A unimodal dataset has one mode. For example, in {2, 4, 4, 6, 8}, the mode is 4. This indicates a single dominant trend, common in straightforward datasets.
Bimodal Datasets
A bimodal dataset has two modes. For instance, {1, 1, 3, 3, 5} has modes 1 and 3. This suggests two distinct trends, useful for identifying dual preferences.
Multimodal Datasets
Multimodal datasets have three or more modes. They reveal complex patterns, often seen in large, diverse datasets. This helps uncover multiple trends.
No Mode Datasets
Some datasets lack a mode. In {1, 2, 3, 4, 5}, no value repeats, so there’s no mode. This indicates uniform distribution, common in small datasets.
Benefits of Using the Mode in Statistics
The mode offers distinct advantages, making it a powerful tool in data analysis. Here’s why it stands out.
Simplicity in Calculation
The mode requires no mathematical formulas. You simply identify the most frequent value. This ease makes it ideal for quick analysis, even for non-experts.
Applicability to Categorical Data
Unlike mean or median, the mode works with non-numerical data. For example, it identifies the most popular product category. This versatility suits diverse fields.
Insight into Popular Trends
The mode highlights what’s most common in a dataset. Businesses use it to stock popular items, like best-selling sizes. It drives strategic decision-making.
Robustness Against Outliers
Outliers skew mean but not the mode. In a dataset like {1, 2, 2, 100}, the mode remains 2. This reliability ensures accurate trend identification.
Versatility Across Disciplines
From marketing to healthcare, the mode adapts to various contexts. It analyzes survey responses, customer preferences, or medical diagnoses effectively.
Mode vs Mean vs Median: Key Differences
Comparison of Central Tendency Measures
Mode, mean, and median serve different purposes in statistical analysis. Mean calculates arithmetic averages, providing overall data balance points. Median identifies middle values when data is arranged in order.
Mode reveals most frequent values, highlighting typical occurrences within datasets. These three measures often differ significantly, especially in skewed distributions. Understanding these differences helps select appropriate measures for specific analyses.
Outliers affect these measures differently. Mean is highly sensitive to extreme values, while median shows more resistance. Mode remains completely unaffected by outliers unless they become the most frequent values.
Also Read: Mean, Median & Mode: Measures of Central Tendency
When to Use Each Measure?
Mean works best for symmetric, normally distributed data without extreme outliers. This measure provides optimal central tendency representation for mathematical calculations and further statistical analysis.
Median suits skewed distributions or datasets containing outliers. This measure provides robust central tendency estimates unaffected by extreme values. Income data and house prices often use median for this reason.
Mode applies to categorical data and situations requiring most common value identification. Customer preferences, product ratings, and demographic categories benefit from mode analysis. Mode also helps identify distribution shapes and patterns.
Practical Applications
Business analytics frequently combines all three measures for comprehensive data understanding. Sales data might use mean for revenue calculations, median for typical transaction values, and mode for most popular products.
Educational assessment employs multiple measures strategically. Mean scores provide overall class performance, median scores show typical student achievement, and mode scores identify most common performance levels.
Healthcare research uses appropriate measures based on data types and research questions. Survival times might use median, treatment costs might use mean, and symptom frequencies might use mode for optimal analysis.
Advanced Mode Concepts and Applications
Modal Classes and Grouped Data
Grouped data analysis requires modal class identification before specific mode calculation. Modal classes represent intervals containing the highest frequencies within grouped datasets. These classes provide approximate mode locations.
Interpolation methods estimate exact modes within modal classes. Linear interpolation assumes uniform distribution within classes, while other methods account for different distribution patterns. These techniques improve mode precision for grouped data.
Histogram analysis visually identifies modal classes and distribution patterns. Peak heights correspond to class frequencies, while peak positions indicate modal locations. Visual analysis complements numerical calculations for better understanding.
Mode in Probability Distributions
Theoretical probability distributions often have well-defined modes based on distribution parameters. Normal distributions have modes equal to their means, while other distributions show different mode-mean relationships.
Continuous probability distributions use probability density functions to identify modes. Mode locations correspond to maximum density values, representing most likely outcomes. These theoretical modes guide practical applications.
Discrete probability distributions identify modes through probability mass functions. Values with highest probabilities represent distribution modes. Understanding theoretical modes helps interpret observed data patterns.
How to Calculate the Mode in a Dataset?
Finding the mode is a simple process. Follow these detailed steps to ensure accuracy.
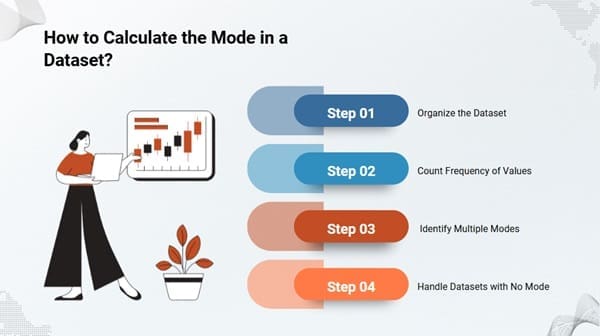
Step 1: Organize the Dataset
Arrange data in ascending order. For example, reorder {5, 3, 7, 5, 9} as {3, 5, 5, 7, 9}. This makes frequency counting easier and reduces errors.
Step 2: Count Frequency of Values
Tally how often each value appears. In {3, 5, 5, 7, 9}, 5 appears twice, others once. The highest frequency identifies the mode.
Step 3: Identify Multiple Modes
Check for values with equal frequencies. In {1, 1, 2, 2, 3}, modes are 1 and 2. Note all modes for bimodal or multimodal datasets.
Step 4: Handle Datasets with No Mode
If no value repeats, like {1, 2, 3, 4}, there’s no mode. Recognize this in uniform datasets and report accordingly.
Example Calculation
Consider the dataset {2, 4, 4, 6, 6, 8}. Frequencies are: 2 (once), 4 (twice), 6 (twice), 8 (once). The modes are 4 and 6, making it bimodal.
Mode Compared to Mean and Median
The mode differs from other measures of central tendency. Understanding these distinctions clarifies its unique role.
Mode in Statistics
The mode focuses on frequency. It’s ideal for categorical data and trend identification. It’s unaffected by extreme values.
Mean in Statistics
The mean calculates the average of all values. For {1, 2, 3}, the mean is 2. It’s sensitive to outliers, unlike the mode.
Median in Statistics
The median is the middle value when ordered. For {1, 2, 3}, the median is 2. It resists outliers, complementing the mode.
When to Use the Mode
Choose the mode for categorical data or to identify popular trends. Use mean for numerical averages, median for skewed data.
Applications of the Mode in Real-World Scenarios
The mode has broad applications across industries. Here’s how it’s used effectively.
Business and Marketing
Retailers use the mode to identify top-selling products. For example, if size “medium” sells most, it’s the mode. This guides inventory planning.
Education and Assessment
Teachers analyze test scores with the mode. If most students score 80, it’s the mode. This informs teaching adjustments.
Healthcare Analysis
In healthcare, the mode tracks common symptoms or diagnoses. For example, the most frequent diagnosis guides resource allocation. Data improves care.
Social Sciences and Surveys
Researchers use the mode in surveys. If “agree” is the most common response, it’s the mode. This shapes policy or research insights.
Market Research
The mode identifies popular customer preferences, like favorite flavors. This informs product development and marketing strategies.
Tools and Technologies for Mode Calculation
Modern tools simplify mode calculation. Here are the most effective options.
Spreadsheets (Excel, Google Sheets)
Spreadsheets offer functions like MODE.SNGL for single modes or MODE.MULT for multiple modes. They handle large datasets efficiently, saving time.
Statistical Software (R, SPSS)
Software like R or SPSS calculates modes quickly. They support advanced data analysis, ideal for researchers and statisticians.
Online Mode Calculators
Free online calculators compute the mode instantly. Users input data and receive results. These are perfect for quick, simple tasks.
Programming Languages (Python)
Python libraries like NumPy or pandas calculate modes programmatically. They suit large-scale data analysis for tech-savvy users.
Challenges of Using the Mode
Despite its strengths, the mode has limitations. Understanding these ensures effective use.
Limited Insight in Small Datasets
Small datasets may lack a clear mode. For example, {1, 2, 3} has no mode. Larger datasets provide clearer results.
Complexity with Multiple Modes
Bimodal or multimodal datasets can confuse interpretation. For example, {1, 1, 2, 2} needs context to understand both modes.
Ineffectiveness with Continuous Data
The mode struggles with continuous data, like measurements. Mean or median often work better. Choose measures based on data type.
Dependence on Data Quality
Inaccurate data skews mode results. For example, errors in recording frequencies mislead analysis. Clean data is critical.
Real-World Examples of the Mode
Practical examples illustrate the mode’s utility. Here are two detailed cases.
Retail Inventory Management
A shoe store tracks sizes sold: {7, 8, 8, 9, 10}. The mode is 8. They stock more size 8 shoes to meet demand.
Customer Preference Surveys
A café surveys favorite drinks: {coffee, tea, coffee, juice, coffee}. The mode is coffee. They prioritize coffee-based promotions.
Best Practices for Effective Mode Use
Maximize the mode’s value with these detailed practices.
Select Appropriate Data Types
Use the mode for categorical or discrete data. It excels in identifying frequent categories, like product preferences.
Combine with Mean and Median
Pair the mode with mean and median for a fuller picture. This balances insights across data types.
Ensure High-Quality Data
Verify data accuracy before analysis. Clean datasets prevent errors in mode identification, ensuring reliable results.
Provide Contextual Interpretation
Interpret modes within the dataset’s context. For surveys, explain what the mode suggests about preferences or trends.
Use Visualization Tools
Visualize modes with histograms or bar charts. This clarifies frequency patterns for stakeholders or teams.
FAQs About Mode in Statistics
What is the mode in statistics?
The mode is the most frequently occurring value in a dataset.
How does the mode differ from mean and median?
Mode focuses on frequency, mean averages values, and median finds the middle.
Can a dataset have multiple modes?
Yes, datasets can be unimodal, bimodal, or multimodal with multiple modes.
When is the mode most useful?
Use the mode for categorical data or to identify popular trends.
What if a dataset has no mode?
No mode exists if all values appear once, indicating uniform data.
What tools help calculate the mode?
Spreadsheets, statistical software, online calculators, and Python compute modes.
How does the mode benefit businesses?
The mode identifies popular products, guiding inventory and marketing strategies.
Final Words
The mode in statistics is a simple yet powerful tool for uncovering data trends. It identifies frequent values, offering insights across industries like retail, healthcare, and education. Despite limitations, its ease and versatility make it indispensable. By combining the mode with mean and median, you gain a comprehensive view of your data. Start leveraging the mode today to drive informed decisions and achieve success in 2025.


