
You want to sharpen your business’s performance, right? Of course you do!
To do that, you must look at your Lean Metrics. These essential tools are how you measure success when you use a Lean approach. Lean thinking is all about cutting out waste and making your processes run smoother and faster.
But, what exactly are these key measurements, and how can they show you where your biggest problems are hiding? Take a read of this to understand how monitoring Lean metrics will help you achieve continuous improvement and a competitive advantage.
Table of contents
What are Lean Metrics?
Lean metrics are a specific set of measures that track how well your processes are working. They tell you if you are meeting your Lean manufacturing or service goals.
Always remember, the main goal of any Lean effort is to maximize customer value while using the fewest resources possible. These metrics are your compass, pointing out the non-value-added steps, which we call waste or Muda.
To understand Lean metrics in clearer terms, they act like a detailed report card. This report card shows you the health of your operations. Instead of just looking at the final profit, you look at how the work actually flows from start to finish.
Why You Need Lean Process Improvement Metrics
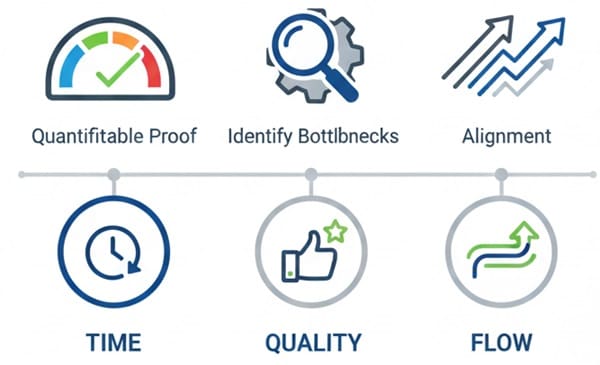
You see, traditional business metrics often focus on money and look backward. On the contrary, Lean process improvement metrics look at time, quality, and flow—things that directly affect the customer right now.
- Quantifiable Proof: You need hard data to prove your improvement efforts are actually working.
- Identify Bottlenecks: They quickly show you the spots in your workflow where things get stuck. Now, the question arises, where does work get stuck? It gets stuck in queues or due to a high amount of Work-in-Progress (WIP).
- Alignment: They make sure every team’s effort lines up with the main business goal: delivering value faster and better.
When you start tracking these numbers, you instantly build curiosity because you begin to see how much time savings you are missing out on.

Public, Onsite, Virtual, and Online Six Sigma Certification Training!
- We are accredited by the IASSC.
- Live Public Training at 52 Sites.
- Live Virtual Training.
- Onsite Training (at your organization).
- Interactive Online (self-paced) training,
Core Time-Based Lean Metrics
Time is money, especially in a Lean system. Among these long-tail lean metrics, time-based measures are the most critical. They show you exactly how fast value moves to your customer.
Lead Time: The Customer’s Wait
Lead Time refers to the total time it takes for work to move through your entire system.
- Lead Time can be understood as the time from the moment a customer request comes in until the moment the product or service is delivered.
- It explains the total duration the customer waits.
- It includes all the time: processing time, waiting time, and transport time.
- Important consideration: Customers only care about this total time. Lowering it is a fundamental Lean goal.
Formula for Total Lead Time:
Total Lead Time = Sum of all Process Times + Sum of all Queue/Delay Times
Cycle Time: Your Efficiency Clock
Cycle Time refers to the total time required to complete one cycle of a specific task or to produce a single unit.
- It explains your internal speed for a single work item.
- It is used to analyze the efficiency of a single process step.
- It includes the process time (when actual work is being done) and the delay time (when the work is waiting).
Formula for Cycle Time:
Cycle Time = Process End Time – Process Start Time
Takt Time: The Customer’s Rhythm
Takt Time is the available production time divided by the required customer demand.
- It explains the rate at which you must complete a product to meet customer orders.
- It is used to set the pace for your production line.
- For instance: If you have 480 minutes of work time and the customer wants 96 units, your Takt Time is 5 minutes per unit. You must finish one unit every 5 minutes.
It keeps your flow balanced and prevents both overproduction and underproduction.
low and Capacity Lean Metrics
These metrics give you a clear view of your operational capacity and the movement of work through the system.
Throughput: The Output Rate
Throughput can be understood as the amount of material or items passing through a system or process per unit of time.
- It explains your production capacity over a set period (e.g., units per hour).
- It is used to gauge the overall output of a specific machine, line, or plant.
- Practical application: If your throughput drops, you know you have a problem, likely a bottleneck in the system.
Formula for Throughput:
Throughput = Number of Units Produced/Time Period
Work-in-Progress (WIP): Unfinished Tasks
Work-in-Progress (WIP) refers to the number of unfinished tasks or products that have been started but are not yet completed.
- It explains the volume of inventory or partially completed work items stuck in the pipeline.
- It is used to streamline workflows and reduce inventory costs.
- Important limitation: High WIP often means longer lead times and less overall efficiency.
You will get to know about the deep link between WIP, Cycle Time, and Throughput by studying Little’s Law further. L = $\lambda \times W$ which relates the number of items in a queuing system (L, or WIP) to the arrival rate ($\lambda$, or Throughput) and the time spent in the system (W, or Flow Time).
Process Cycle Efficiency (PCE): The Value Percentage
Process Cycle Efficiency (PCE) is the ratio of Value-Added Time to Total Lead Time.
- It explains what percentage of the total process time is actually adding value for the customer.
- It is used to detect how much of your process is waste (non-value-added time).
- For example: If your Lead Time is 40 hours but only 4 hours is Value-Added Time, your PCE is 10%. This instantly shows you have 90% waste to eliminate.
Also Read: Lean Six Sigma in Las Vegas Casinos
Quality and Equipment Lean Metrics
Measuring time is not enough. You must also measure how well you do the job and how reliable your equipment is.
Overall Equipment Effectiveness (OEE): Machine Health
Overall Equipment Effectiveness (OEE) is a comprehensive metric that measures the percentage of planned production time that is truly productive.
- It explains how well a piece of equipment or an entire production line is being used.
- It is used as a foundational Lean KPI in lean manufacturing metrics.
- It is the product of three factors: Availability, Performance, and Quality.
The Three Pillars of OEE:
- Availability Rate: The percentage of time the machine is running when it should be.
- Performance Rate: How fast the machine is running compared to its theoretical maximum speed.
- Quality Rate: The percentage of production that meets quality standards (First Pass Yield).
Formula for OEE:
OEE = Availability * Performance * Quality
First Pass Yield (FPY): Getting it Right
First Pass Yield (FPY) refers to the percentage of products manufactured right and to specifications the first time through the process.
- It explains the quality level without any need for rework or scrap.
- It is used to identify quality issues and is a key component in total quality management.
- Conversely, a low FPY means a high Defect Rate and a high Cost of Poor Quality (COPQ), which eats into your profits.
How to Implement Lean Metrics for Success
Implementing these continuous improvement metrics is not just about crunching numbers. It is about changing how you think about your work.
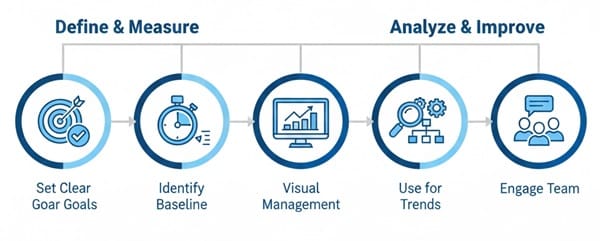
Define and Measure
Initially, you need to pick a specific process or problem to improve.
- Set Clear Goals: What does success look like? Do you want to reduce Lead Time by 25%? Make your goal S.M.A.R.T.
- Identify Your Baseline: You must know where you are starting. Measure your current Cycle Time and Defect Rate before you make any changes.
- Visual Management: Make your chosen metrics visible! Post them on a wall chart, or Andon board, near the work area (Gemba). This helps create engagement.
Analyze and Improve
Once you have the data, you can start digging.
- Look for Trends: Is your Throughput dropping every Tuesday? Is your WIP rising before a holiday? These trends point to a root cause.
- Use Tools: Employ tools like Value Stream Mapping or Bottleneck Analysis to study the process. This will help you discover the non-value-added activities.
- Engage the Team: The people doing the work know the process best. Ask them what causes the delays or the low First Pass Yield. This is the spirit of Kaizen.
Also Read: Integrating Six Sigma with Lean & ISO
Key Stakeholders in Lean Measurement
There are three key parties involved in tracking and acting on Lean Metrics:
- Operators/Frontline Staff: They collect the raw data, see the issues in real-time, and suggest the most practical continuous workflow improvement ideas.
- Managers: They own the process. They use the metrics to prioritize projects, allocate resources, and support the Kaizen activities.
- Executives: They look at the high-level Lean KPIs (like Lead Time and Return on Assets) to ensure the improvement efforts are meeting the strategic business objectives.
Final Words
Therefore, embracing Lean metrics is the only way to move from simply working to truly improving your business. By focusing on metrics like Lead Time, Cycle Time, OEE, and First Pass Yield, you are not just tracking numbers; you are creating a culture of data-driven decision-making.
When your goal is cost reduction and higher customer satisfaction, Lean Metrics are the recommended choice. They shine a light on waste, giving you the power to eliminate it and deliver value with speed and quality. This commitment to efficiency is what sets industry leaders apart.
FAQs on Lean Metrics
1. What are the Main Lean Metrics You Should Track?
The main Lean Metrics fall into three areas: Flow (Lead Time, Cycle Time), Quality (First Time Yield, Defects Per Unit), and Efficiency (Overall Equipment Effectiveness or OEE).
2. How Do Lean Metrics Help Improve Business Processes?
Lean Metrics make waste visible by measuring non-value-added time and errors. They show where processes are slow or faulty, allowing teams to focus efforts on eliminating delays and rework for faster delivery.
3. What is the Difference Between Lead Time and Cycle Time in Lean?
Lead Time is the total time the customer waits from order to delivery. Cycle Time is the time taken to complete one specific task or step in the process, reflecting the internal speed of work.
4. Why is Overall Equipment Effectiveness (OEE) Important for Manufacturing Lean Metrics?
Overall Equipment Effectiveness (OEE) is critical because it measures how productively equipment is running. It combines Availability, Performance, and Quality into a single score, highlighting hidden capacity loss and prioritizing maintenance.
5. How Can a Company Start Using Lean Metrics Today?
Start by identifying your value stream and choosing one simple metric, like Lead Time, for your main product. Visualize the data on a chart to track progress, and set a small goal for continuous improvement (Kaizen).
About Six Sigma Development Solutions, Inc.
Six Sigma Development Solutions, Inc. offers onsite, public, and virtual Lean Six Sigma certification training. We are an Accredited Training Organization by the IASSC (International Association of Six Sigma Certification). We offer Lean Six Sigma Green Belt, Black Belt, and Yellow Belt, as well as LEAN certifications.
Book a Call and Let us know how we can help meet your training needs.


