
Control limits mark the boundary between normal process variation and a real problem. Every control chart uses two limits. These are the upper control limit (UCL) and the lower control limit (LCL). Statistician Walter Shewhart set this standard in 1924. He fixed control limits at three standard deviations from the process mean. That decision still shapes how manufacturers monitor quality today. This guide covers the formula, the history, and how to read a chart correctly.
Table of contents
Key Takeaways
- Control limits mark the UCL and LCL on a control chart.
- Shewhart set the three-sigma rule at Bell Labs in 1924.
- Control limits come from process data, not customer requirements.
- Chebyshev’s theorem guarantees at least 89 percent of data within three sigma.
- Patterns inside the limits can signal problems before a single point crosses them.
What Are Control Limits?
Control limits define the expected range of a stable process. They sit above and below the process average. The upper control limit marks the highest expected value. The lower control limit marks the lowest expected value. Most control charts set both limits at three standard deviations from the mean.
Control limits separate two types of variation. Common cause variation is the normal, expected noise in any process. Special cause variation signals something changed. A point outside the control limits usually means special cause variation is present.

Public, Onsite, Virtual, and Online Six Sigma Certification Training!
- We are accredited by the IASSC.
- Live Public Training at 52 Sites.
- Live Virtual Training.
- Onsite Training (at your organization).
- Interactive Online (self-paced) training,
Control Limits vs. Specification Limits
Many teams confuse control limits with specification limits. The two come from completely different sources.
Control limits come from the process itself. They reflect what the process actually does. Specification limits come from the customer or a standard. They reflect what the process should do.
| Control Limits | Specification Limits |
| Based on process data | Based on customer or design requirements |
| Show what the process is actually doing | Show what the process should be doing |
| Calculated from the mean and standard deviation | Set by engineering, contract, or industry standards |
| Change only when the process itself changes | Change only when requirements change |
| Used to detect special cause variation | Used to judge if output meets requirements |
A process can be in control and still fail specification. A stable process can also miss customer requirements entirely. That gap is why teams track both limit types, not just one.
Also Read: Common Cause Variation: Definition, Examples, and How to Reduce It
How to Calculate Control Limits
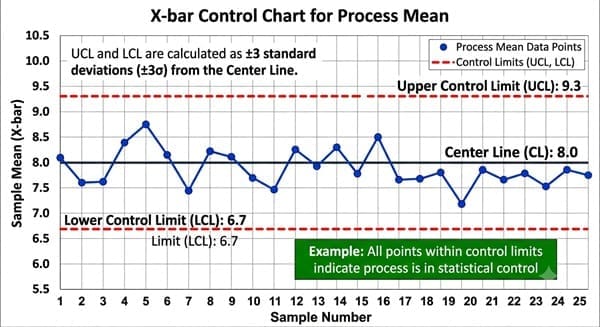
The general formula is simple. Add or subtract three standard deviations from the process mean.
- UCL equals the mean plus three sigma.
- LCL equals the mean minus three sigma.
The exact formula changes by chart type. An X-bar and R chart uses a constant called A2, multiplied by the average range. An X-bar and S chart uses sample standard deviation instead of range. A p-chart for defect rates uses a different formula based on sample proportion. Individual-value charts use a moving range between consecutive points instead. Always match the formula to the chart type you are plotting.
Where the 3-Sigma Rule Came From
Walter Shewhart worked as a physicist at Bell Telephone Laboratories. He needed a way to control the quality of telephone equipment. In 1924, Shewhart drew the first control chart with fixed limits. He set those limits at three standard deviations from the average. This was not an arbitrary number.
Shewhart balanced two economic risks. Setting limits too tight causes constant, needless adjustment. Setting limits too wide lets real problems go undetected. Three sigma struck the most practical balance between both risks.
Chebyshev’s theorem backs this choice mathematically. It guarantees a minimum percentage of data within k standard deviations, for any distribution shape. At three standard deviations, that guarantees at least 89 percent of the data. This holds true regardless of the distribution’s shape. For a normal distribution, the real figure is closer to 99.7 percent.
Common Cause vs. Special Cause Variation
Misreading variation type causes two common errors. The first error treats common cause variation as special cause. Teams chase a random blip that was never a real signal. This wastes time and can add new variation to a stable process.
The second error treats special cause variation as common cause. Teams ignore a real signal, assuming it is normal noise. A genuine problem then goes uninvestigated and often gets worse.
Deming called the first error tampering. Reacting to normal noise usually makes a process less predictable, not more.
Also Read: Special Cause Variation
Beyond a Single Point: Reading Patterns in a Control Chart
A single point outside the limits is not the only signal. Patterns inside the limits can flag a shift too.
- Nine points in a row on one side of the average often signal a shift.
- Six points steadily rising or falling suggest a trend, not noise.
- Fourteen points alternating up and down can signal over-adjustment or a fixture problem.
These pattern rules are known as the Western Electric rules. They catch drift before a point ever crosses the limit.
A three-sigma control chart still produces a false alarm about once every 371 points. That happens on average, even in a stable process. Adding extra pattern rules, like the Western Electric rules, catches drift earlier. But those extra rules raise the false alarm rate too. Studies show the rate rises to about once in every 92 points. Teams must weigh faster detection against more false alarms.
Three Best Practices for Using Control Limits
1. Recalculate limits only after a real process change. Only recalculate control limits after a confirmed process change. New tooling, new material, or a finished improvement project all qualify. Never widen limits just to make bad points disappear.
2. Match the formula to your chart type. Use the correct formula for your specific chart type. An X-bar and R chart needs different math than a p-chart. Using the wrong formula produces limits that mean nothing.
3. Investigate every out-of-limits point immediately. Investigate every point outside the limits right away. Find the assignable cause before the trail goes cold. Document the fix so the same cause does not repeat.
How Six Sigma Development Solutions Inc. Can Help
Reading a control chart correctly takes practice, not just formulas. Six Sigma Development Solutions Inc. teaches this inside our Green Belt and Black Belt programs.
We offer onsite, live virtual, and online Six Sigma training. Learners build and interpret real control charts, not just memorize formulas.
Ready to read your own process data with confidence? Explore our training options and get certified today.
Frequently Asked Questions on Control Limits
Q: What is the difference between control limits and specification limits?
A: Control limits come from process data. Specification limits come from customer requirements. They rarely match exactly.
Q: What is the standard formula for control limits?
A: The formula is the mean plus or minus three sigma. The exact math changes by chart type.
Q: Who invented control limits? A: Walter Shewhart invented control limits in 1924. He worked as a physicist at Bell Telephone Laboratories.
Q: Why are control limits set at three sigma?
A: Three sigma balances two risks. It avoids both false alarms and missed real problems.
Q: Can a process be in control but still fail specification?
A: Yes. A stable process can still miss customer requirements entirely. That is why teams track both limit types.
Want to build control charts your team actually trusts? Six Sigma Development Solutions Inc. offers onsite, live virtual, and online training for every belt level.
About Six Sigma Development Solutions, Inc.
Six Sigma Development Solutions, Inc. offers onsite, public, and virtual Lean Six Sigma certification training. We are an Accredited Training Organization by the IASSC (International Association of Six Sigma Certification). We offer Lean Six Sigma Green Belt, Black Belt, and Yellow Belt, as well as LEAN certifications.
Book a Call and Let us know how we can help meet your training needs.


