
Did you know that causal loop diagrams can reveal why some problems persist despite our best efforts to solve them? These powerful systems thinking diagrams untangle complex relationships, showing how actions ripple through a system, often looping back in unexpected ways.
Whether you’re exploring a time travel paradox in science fiction or analyzing feedback loops in business, understanding causal loop diagrams unlocks a deeper perspective on how systems work.
A casual loop diagram represents a powerful visual mapping technique that illustrates the interconnected relationships between different variables in complex systems. Unlike linear thinking models, these diagrams reveal how actions create reactions that eventually circle back to influence the original cause, creating continuous feedback loops.
Systems thinking is circular rather than linear because it recognizes that events don’t happen in isolation. Instead, every action triggers a chain reaction that ultimately returns to affect the starting point. This circular causality forms the foundation of effective systems analysis.
Table of contents
What Is a Causal Loop Diagram?
A causal loop diagram (CLD) is a visual tool used in systems thinking to map out cause-and-effect relationships within a system. Unlike linear models, which assume a straightforward path from cause to result, CLDs embrace the circular nature of systems thinking.
This means they highlight how variables influence one another, often creating feedback loops that either amplify or stabilize outcomes. Imagine a web of causation where one action sparks a chain reaction, looping back to influence the original cause.
For example, in a simple causal loop diagram, you might see how increased customer satisfaction boosts sales, which leads to more investment in customer service, further enhancing satisfaction. This reinforcing loop creates a cycle of growth. But CLDs can also reveal balancing loops, where a system self-corrects, like a thermostat adjusting room temperature.
By visualizing these dynamics, CLDs help us understand complex systems, from business operations to ecological cycles or even a temporal causality loop in a sci-fi plot.

Public, Onsite, Virtual, and Online Six Sigma Certification Training!
- We are accredited by the IASSC.
- Live Public Training at 52 Sites.
- Live Virtual Training.
- Onsite Training (at your organization).
- Interactive Online (self-paced) training,
Core Components of Causal Loop Diagrams
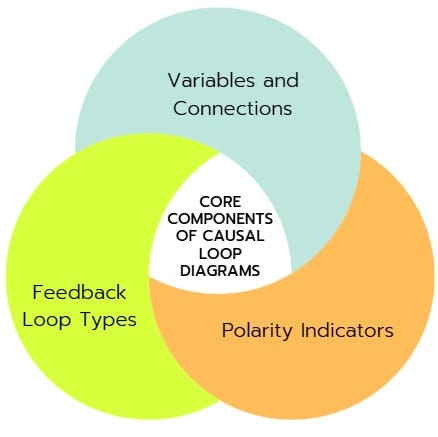
Variables and Connections
Every causal loop diagram consists of variables connected by arrows that show directional influence. These variables represent measurable elements within your system, such as customer satisfaction, employee productivity, or market demand.
Polarity Indicators
Each connection features polarity markers – either positive (+) or negative (-) signs. Positive polarity means variables move in the same direction, while negative polarity indicates they move in opposite directions.
Feedback Loop Types
Reinforcing Loops (R): These amplify or accelerate change within the system. When positive feedback creates exponential growth or decline, you’re witnessing reinforcing loops in action.
Balancing Loops (B): These seek equilibrium and stability. Balancing loops work like thermostats, automatically adjusting to maintain desired conditions.
Why Systems Thinking Is Circular, Not Linear?
Systems thinking is circular rather than linear—what does this mean? Linear thinking assumes a direct path: A leads to B, and B leads to C. But in reality, systems are rarely so tidy. Circular thinking, the heart of systems thinking diagrams, recognizes that C might loop back to influence A, creating a feedback loop.
This perspective is critical for understanding phenomena like time paradoxes or business cycles, where effects become causes in an ongoing dance. By mapping these relationships, causal loop diagrams make the invisible visible, helping us anticipate unintended consequences.
Types of Feedback Loops in Causal Loop Diagrams
Causal loop diagrams revolve around two main types of feedback loops: reinforcing and balancing. Understanding these loops is key to grasping how systems evolve or stabilize over time.
Reinforcing Loops: The Snowball Effect
Reinforcing loops amplify change, creating a snowball effect. For instance, consider a viral social media post. As more people share it, visibility increases, leading to even more shares. This cycle continues until an external factor, like saturation, slows it down. In a causal loop diagram, this might look like:
- Shares → Visibility → More Shares
Reinforcing loops are common in growth scenarios, like business expansion or ecological population booms, but they can also spiral into negative outcomes, like runaway inflation.
Balancing Loops: The Stabilizer
Balancing loops work to maintain stability, counteracting change to keep a system in check. Think of a predator-prey relationship: as the prey population grows, predators thrive, reducing the prey population, which then limits predator growth. This creates a natural balance. In a CLD, it might be diagrammed as:
- Prey Population → Predator Growth → Prey Decline → Predator Decline
Balancing loops are essential in systems like public health, where interventions aim to stabilize outcomes, such as controlling disease spread.
Also Read: Workflow Diagram vs. Process Flow Diagram: Key Differences
How to Create a Causal Loop Diagram?
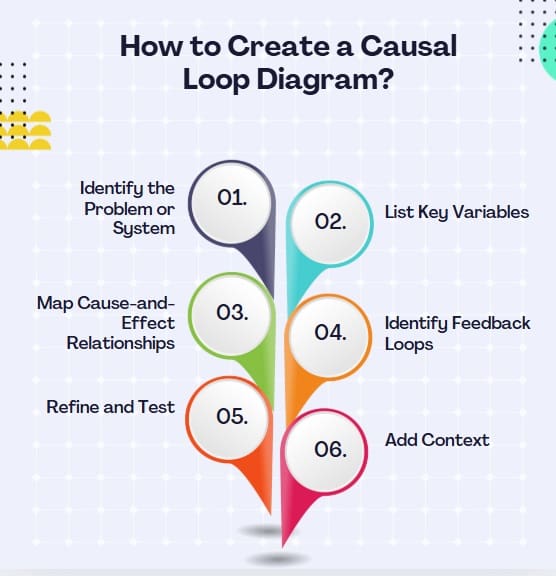
Crafting a causal loop diagram might seem daunting, but it’s like drawing a map of a story. Here’s a step-by-step guide to building your own, whether you’re using a causal loop diagram tool or sketching by hand.
- Identify the Problem or System: Start with a clear focus, like “Why does employee turnover remain high?” or “How does a time loop paradox work in storytelling?”
- List Key Variables: Pinpoint the main elements. For turnover, variables might include job satisfaction, workload, and retention rates. For a time travel loop, think of events, decisions, or paradoxes.
- Map Cause-and-Effect Relationships: Draw arrows between variables to show influence. Label each arrow with a “+” (positive effect, where an increase in one variable boosts another) or “-” (negative effect, where an increase reduces another).
- Identify Feedback Loops: Look for loops where variables circle back. Are they reinforcing (amplifying) or balancing (stabilizing)?
- Refine and Test: Use a causal loop diagram maker or software like Vensim or Stella to simulate outcomes. Adjust as needed to reflect real-world dynamics.
- Add Context: Include external factors or delays (e.g., time lags in decision-making) to make the diagram more robust.
Tools and Templates
Creating a CLD is easier with the right tools. Software like Vensim, Stella, or Kumu offers user-friendly interfaces for building and analyzing diagrams. For beginners, a causal loop diagram template can simplify the process—just plug in your variables and relationships. Online platforms like Lucidchart also provide feedback loop templates, making it easy to collaborate and visualize systems thinking diagrams.
Examples
To bring CLDs to life, let’s explore examples across different fields, showing how these diagrams illuminate complex systems.
Example 1: Public Health and Disease Control
In public health, causal loop diagrams are invaluable for mapping disease dynamics. Consider a CLD for controlling an infectious disease:
- Infection Rate → Public Health Measures (like vaccinations) → Reduced Infections → Fewer Measures Needed
This balancing loop shows how interventions stabilize infection rates. However, a reinforcing loop might emerge if reduced measures lead to complacency, causing infections to spike again. Such diagrams help policymakers anticipate long-term effects.
Example 2: Business and Customer Retention
In a business context, a CLD might explore customer retention:
- Customer Satisfaction → Repeat Purchases → Revenue Growth → Investment in Service → Higher Satisfaction
This reinforcing loop drives growth, but a balancing loop, like rising costs limiting investment, could stabilize or hinder progress. Businesses use these diagrams to strategize effectively.
Example 3: Causal Loop in Time Travel Paradoxes
Let’s get creative with a sci-fi example: the ontological paradox, a type of causal loop time travel scenario. Imagine a character receives a book from their future self, studies it, and later gives it to their past self, creating a temporal causality loop. A CLD might look like:
- Book Received → Knowledge Gained → Book Given to Past Self → Book Received
This loop has no clear origin, embodying the paradox. Such diagrams are used in storytelling to ensure logical consistency in time loop theory narratives.
Example 4: Customer Service Quality Loop
- Customer Complaints (+) → Management Attention (+) → Resource Investment (+) → Service Quality (+) → Customer Satisfaction (+) → Customer Complaints (-)
This balancing loop shows how complaints trigger improvements that eventually reduce future complaints.
Example 5: Employee Burnout Reinforcing Loop
- Workload (+) → Stress (+) → Mistakes (+) → Rework Required (+) → Workload (+)
This reinforcing loop demonstrates how excessive workload creates a vicious cycle of declining performance and increasing demands.
Causal Loop Diagrams and Time Travel Paradoxes
Causal loop diagrams shine in analyzing time travel paradoxes, like the causal loop paradox or time loop paradox. These paradoxes occur when an event causes itself, creating a closed loop with no apparent beginning or end. For instance, in the movie Predestination, a character’s actions in the past and future form a self-sustaining loop, perfectly illustrated by a CLD:
- Action in Future → Effect in Past → Action in Future
This temporal loop fascinates audiences and challenges writers to maintain narrative coherence. By mapping these relationships, CLDs help creators avoid plot holes in stories involving paradox time travel.
Why Causal Loop Diagrams Matter?
CLDs are more than just diagrams—they’re a way to think critically about interconnected systems. They reveal hidden dynamics, like how a small change in one variable can cascade through a system. In fields like public health, business, or environmental science, they guide decision-making by highlighting unintended consequences. In creative writing, they ensure logical consistency in complex narratives like time travel stories.
Moreover, CLDs foster collaboration. Teams can use them to align on problem-solving, whether designing a feedback loop drawing for a corporate strategy or a web of causation template for epidemiological research. Their versatility makes them indispensable across disciplines.
Also Read: What is an Activity Network Diagram?
Tips for Crafting Effective Causal Loop Diagrams
To make your CLDs clear and impactful, consider these tips:
- Keep It Simple: Start with a simple causal loop diagram example to avoid overwhelming complexity.
- Use Clear Labels: Ensure variables and relationships are easy to understand.
- Incorporate Delays: Account for time lags, as they often influence system behavior.
- Validate with Data: Test your diagram against real-world data or scenarios to ensure accuracy.
- Engage Your Audience: Use visuals to make your loop diagram example compelling and accessible.
Common Pitfalls and How to Avoid Them
While CLDs are powerful, they’re not foolproof. Here are common mistakes and how to dodge them:
- Overcomplicating the Diagram: Too many variables can muddle insights. Focus on key drivers.
- Ignoring Delays: Systems often have time lags—include them to reflect reality.
- Neglecting Context: External factors can disrupt loops. Incorporate them for a holistic view.
- Mislabeling Relationships: Double-check whether relationships are positive or negative to avoid errors.
FAQs About Causal Loop Diagrams
What is a causal loop diagram used for?
A causal loop diagram maps cause-and-effect relationships in a system, highlighting feedback loops to understand dynamics in fields like business, public health, or storytelling.
How do you create a simple causal loop diagram?
Identify the system’s key variables, map their cause-and-effect relationships with arrows, label them as positive or negative, and identify reinforcing or balancing loops.
What’s the difference between reinforcing and balancing loops?
Reinforcing loops amplify change, creating growth or decline, while balancing loops stabilize a system, counteracting change to maintain equilibrium.
Can causal loop diagrams help with time travel paradoxes?
Yes, they’re excellent for visualizing temporal causality loops, ensuring logical consistency in narratives involving time loop theory or ontological paradoxes.
What tools can I use to create a causal loop diagram?
Tools like Vensim, Stella, Kumu, or Lucidchart offer user-friendly platforms for building and analyzing CLDs, often with customizable templates.
Final Words
Causal loop diagrams are a window into the heart of complex systems, revealing how actions and consequences intertwine. Whether you’re tackling a time travel paradox, optimizing a business strategy, or addressing public health challenges, CLDs empower you to see the bigger picture. By embracing systems thinking and mastering feedback loops, you can anticipate outcomes, solve problems, and craft compelling narratives.


