
Carrying costs — also called inventory holding costs — are the total annual expenses a business incurs for keeping inventory on hand. They cover the capital tied up in stock, the physical cost of storing it, insurance and taxes, and the risk that products will become obsolete, damaged, or stolen before they sell.
According to APQC benchmarking data and the Institute for Supply Management (ISM), carrying costs typically run between 20% and 30% of average inventory value per year. In Lean Six Sigma, inventory is one of the eight wastes. Carrying costs are the price tag on that waste.
Table of contents
Meaning of Carrying Costs
Carrying costs are the total annual expenses of holding inventory, expressed as a percentage of average inventory value. They include capital opportunity cost (money tied up in stock), storage and warehousing, insurance and taxes, and risk costs including obsolescence, shrinkage, and damage. Industry benchmarks from APQC and ISM set the typical range at 20% to 30% of inventory value per year.
The formula is: Carrying Cost % = (Total Annual Carrying Costs / Average Inventory Value) x 100. In Lean Six Sigma, carrying costs represent the financial impact of the inventory waste category and are a primary target for DMAIC improvement projects.
Key Takeaways
- Carrying costs include four components: capital cost, storage and warehousing cost, service cost (insurance, taxes, administration), and risk cost (obsolescence, shrinkage, damage).
- APQC benchmarking data shows carrying costs typically range from 20% to 30% of total average inventory value per year. ISM cites the same range as the target most companies aim for.
- Capital opportunity cost is the largest single component for most businesses. It represents funds tied up in inventory that cannot be used for other business purposes. At a cost of capital of 8% to 12%, this component alone represents a significant annual expense.
- The carrying cost formula is: Carrying Cost % = (Capital Cost + Storage Cost + Service Cost + Risk Cost) / Average Inventory Value × 100.
- A business holding $500,000 in average inventory at a 25% carrying rate spends $125,000 per year just to hold that stock.
- In Lean methodology, excess inventory is one of the eight wastes. Carrying costs are the direct financial measure of that waste.
- Six Sigma’s DMAIC framework provides a structured approach to identifying the root causes of excess inventory and implementing controls that keep inventory at the minimum level needed to meet customer demand.

Public, Onsite, Virtual, and Online Six Sigma Certification Training!
- We are accredited by the IASSC.
- Live Public Training at 52 Sites.
- Live Virtual Training.
- Onsite Training (at your organization).
- Interactive Online (self-paced) training,
What Are Carrying Costs?
Carrying costs represent the financial burden of owning inventory. Once a business pays for stock, it does not simply sit on a shelf for free. Every unit in a warehouse costs money every day it remains unsold.
The term “carrying cost” and “holding cost” mean the same thing. Both describe the total annual expense of keeping inventory on hand, covering capital, storage, insurance, and risk. Some finance teams use “carrying cost” for the percentage rate and “holding cost” for the dollar figure, but the underlying concept is identical.
Carrying cost is not a single line item. It aggregates across five cost categories, each with different drivers and different reduction levers.
Most businesses significantly underestimate their carrying costs because the components appear across multiple expense categories — warehouse rent, insurance premiums, write-offs, financing costs, and labor. No single financial report consolidates them as one number. This invisibility is precisely what makes carrying costs one of the largest controllable expenses in supply chain operations.
Also Read: Six Sigma in Last Mile Delivery: Cutting Failed Attempts and Costs
The Four Components of Carrying Costs

Every carrying cost figure is built from four categories. Understanding each one separately is essential for identifying where reduction opportunities actually exist.
1. Capital Cost (Opportunity Cost)
Capital cost is the largest single component for most businesses. Funds tied up in inventory cannot be deployed elsewhere. At a cost of capital of 8% to 12%, this component alone represents a significant drag on inventory-heavy operations.
Every dollar locked in stock is a dollar that cannot fund equipment upgrades, marketing campaigns, workforce development, or other revenue-generating investments. When a business borrows to fund inventory purchases, the interest on that borrowing is a direct, measurable capital cost. When a business uses its own cash, the cost is the return that cash would have earned in its next best use. Capital cost typically contributes 8% to 15% of inventory value annually depending on the company’s cost of capital.
2. Storage and Warehousing Cost
Storage cost covers all expenses tied to the physical space where inventory sits. This includes facility lease or ownership costs, utilities, material handling equipment, and the labor required to receive, put away, locate, and pick stock. Costs scale with inventory volume and vary by storage type. Climate-controlled storage for temperature-sensitive products carries a premium over standard dry storage.
Storage costs are directly controllable. Reducing inventory volume reduces the warehouse space required. Improving warehouse layout reduces the labor required to handle each unit.
3. Service Costs
Service costs include property insurance on inventory value, applicable inventory taxes, and the administrative systems and labor used to manage and track stock. Insurance and taxes vary by jurisdiction and product type and are often underestimated in carrying cost calculations.
The administrative component includes the time spent on cycle counting, physical inventory audits, inventory record management, and compliance reporting. This cost grows proportionally with the number of SKUs and inventory locations managed.
4. Risk Costs
Risk costs cover obsolescence, damage, theft, and losses from products that expire, go out of season, or are otherwise rendered unsaleable.
Risk cost is the most variable and most controllable component. In many product categories it runs 5% to 10% of inventory value annually. In perishables, it can exceed 15%.
Obsolescence risk is highest in industries with short product life cycles: electronics, fashion, and pharmaceuticals. A component that is superseded by a new model or a drug that passes its expiration date on a warehouse shelf represents a total loss of its carrying investment, not just a carrying cost.
The Carrying Cost Formula
The standard carrying cost formula is:
Carrying Cost % = (Capital Cost + Storage Cost + Service Cost + Risk Cost) / Average Inventory Value × 100
Average inventory value uses the mean of beginning and ending inventory for the period, or a rolling average for businesses with significant seasonal variation.
Worked Example
A manufacturing company holds an average of $500,000 in spare parts and raw materials. Its annual carrying costs break down as follows:
| Cost Component | Annual Amount | % of Inventory |
| Capital cost (10% cost of capital) | $50,000 | 10% |
| Storage and warehousing | $35,000 | 7% |
| Insurance and taxes | $10,000 | 2% |
| Obsolescence, shrinkage, damage | $30,000 | 6% |
| Total carrying cost | $125,000 | 25% |
Carrying Cost % = ($125,000 / $500,000) × 100 = 25%
This company spends $125,000 per year — or 25 cents for every dollar of inventory — just to hold its stock. This figure does not include the purchase cost of the inventory itself.
The rate matters because it turns a static balance-sheet number into an annual bill that can be compared against ordering costs, stockout costs, and improvement projects.
Also Read: Which Country Values Lean Six Sigma Certification the Most?
Industry Benchmarks for Carrying Costs
Most companies strive for between 20% and 30% of total inventory costs, according to ISM benchmarking data. There are no consensus benchmarks, though the more components a company includes in the calculation, the higher the percentage will be.
A carrying cost between 20% and 30% of inventory value is typical, per APQC benchmarking data.
Industry-specific benchmarks vary considerably:
| Industry | Typical Carrying Cost Range | Primary Driver |
| Manufacturing | 20% to 30% | Capital cost and raw material obsolescence |
| Perishable food | 30% to 40% | Risk cost from short shelf life |
| Electronics | 25% to 35% | Rapid obsolescence of components |
| Apparel and CPG | 20% to 25% | Seasonal obsolescence and storage |
| Spare parts and MRO | Often above 30% | Slow movement and obsolescence risk |
Capital and obsolescence, not storage, dominate the bill across most categories. Many operations managers focus improvement efforts on storage costs because they are the most visible. Capital cost is the actual lever in most organizations.
If a company’s carrying cost exceeds 30%, it typically signals overstocking, high obsolescence rates, or a cost of capital that is above the industry norm. Each of these requires a different response, which is exactly why the DMAIC structured problem-solving approach is valuable for carrying cost reduction.
Carrying Costs in Lean Six Sigma
In Lean methodology, excess inventory is one of the eight wastes. High carrying costs are almost always a symptom of a coordination failure, not a purchasing failure. Individual procurement decisions often look rational in isolation. The problem emerges at the boundary between functions.
Carrying costs are the price tag on that coordination failure. They quantify exactly how much the organization pays each year for inventory that is held longer than necessary to serve the customer.
Carrying Costs and the 7 (8) Wastes of Lean
Lean identifies excess inventory as waste because inventory beyond what current customer demand requires does not add value. It consumes capital, floor space, handling time, and management attention. When that inventory eventually becomes obsolete or is damaged, the loss is both the purchase cost and the accumulated carrying costs paid up to that point.
Identifying and eliminating the root causes of excess inventory — forecast errors, long lead times, batch ordering, lack of supplier reliability, poor demand visibility — is one of the primary objectives of a Lean value stream mapping exercise.
Carrying Costs and Economic Order Quantity (EOQ)
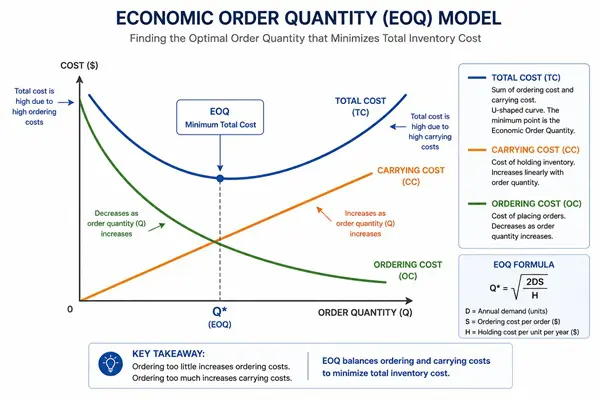
Understanding carrying costs helps determine your Economic Order Quantity (EOQ). EOQ finds the order size that minimizes the total of ordering costs and carrying costs. As carrying costs rise, the optimal order quantity falls, favoring more frequent, smaller orders over large, infrequent ones.
Without an accurate carrying cost figure, EOQ calculations produce incorrect results. Many businesses underestimate carrying costs by omitting capital cost from their calculation, which causes them to order in larger quantities than their true total cost structure justifies.
How DMAIC Reduces Carrying Costs

Carrying costs are an ideal DMAIC project target. They are measurable, they have identifiable root causes, and reducing them produces direct financial benefit.
Define
The project charter identifies the current carrying cost rate, the target rate, and the financial value of the gap. For a business holding $1 million in inventory at a 28% carrying rate with a target of 22%, the annual savings opportunity is $60,000. This defines the project’s business case.
Measure
The team collects data on each carrying cost component. Storage costs come from warehouse expense reports. Capital costs require the business’s cost of capital applied to average inventory value. Risk costs require write-off and shrinkage data from accounting.
Analyze
Root cause analysis investigates why inventory is being held longer than necessary. Common causes include inaccurate demand forecasts driving over-ordering, long supplier lead times that require larger safety stock, batch ordering policies that create peaks in inventory, and slow-moving SKUs that accumulate without review.
Improve
Targeted improvements address confirmed root causes. Demand forecasting improvements reduce over-ordering. Supplier lead time reduction (through supply chain development or alternative sourcing) reduces required safety stock levels. Just-in-Time delivery agreements reduce average inventory position. Kanban systems signal replenishment based on actual consumption rather than forecasts.
Control
Process controls prevent excess inventory from accumulating again. Reorder point monitoring, inventory turnover KPI dashboards, and regular SKU rationalization reviews sustain the improvement. Statistical Process Control charts on inventory levels by category flag when a category begins drifting above its target range, triggering investigation before carrying costs compound.
Frequently Asked Questions: Carrying Costs
Q: What are carrying costs?
A: Carrying costs — also called holding costs — are the total annual expenses of keeping inventory on hand. They include four components: capital opportunity cost (money tied up in stock), storage and warehousing costs, service costs (insurance, taxes, administration), and risk costs (obsolescence, shrinkage, damage). They are expressed as a percentage of average inventory value and typically run between 20% and 30% per year, according to APQC and ISM benchmarking data.
Q: What is the carrying cost formula?
A: The standard carrying cost formula is: Carrying Cost % = (Capital Cost + Storage Cost + Service Cost + Risk Cost) / Average Inventory Value × 100. The dollar amount of carrying costs equals: Carrying Cost Rate × Average Inventory Value. For example, a business with $500,000 in average inventory at a 25% carrying rate spends $125,000 per year to hold that inventory.
Q: What is the difference between carrying cost and holding cost?
A: There is no difference. Carrying cost and holding cost are interchangeable terms that both describe the total annual expense of keeping inventory on hand. Some finance teams use carrying cost for the percentage rate and holding cost for the dollar figure, but the underlying calculation and components are identical.
Q: What is a typical carrying cost percentage?
A: According to APQC benchmarking data and the Institute for Supply Management (ISM), carrying costs typically range from 20% to 30% of average inventory value per year for most industries. Perishable food runs higher at 30% to 40%. Electronics runs 25% to 35% due to rapid obsolescence. Apparel and shelf-stable consumer goods typically run 20% to 25%. Manufacturing typically runs 20% to 30% depending on raw material complexity and capital cost.
Q: What is the largest component of carrying costs?
A: Capital opportunity cost is the largest single component for most businesses, typically representing 8% to 15% of inventory value annually. It reflects the cost of funds tied up in inventory that cannot be used for other investments. Many operations managers focus improvement efforts on storage costs because they are visible, while the capital cost component — which is larger — goes unaddressed.
Q: How do carrying costs connect to Lean Six Sigma?
A: In Lean methodology, excess inventory is one of the eight wastes. Carrying costs are the financial measurement of that waste. DMAIC improvement projects targeting inventory reduction directly reduce carrying costs by addressing the root causes of why inventory accumulates above the level needed to serve customer demand, including forecast errors, long lead times, batch ordering, and slow-moving SKUs.
Q: How do carrying costs affect the Economic Order Quantity (EOQ)?
A: EOQ finds the order size that minimizes the total of ordering costs and carrying costs. As carrying costs increase, the optimal order quantity decreases, favoring more frequent, smaller orders. Businesses that underestimate carrying costs by omitting the capital cost component calculate an EOQ that is larger than their true total cost structure justifies, leading to systematic overstocking.
Carrying Costs Training in Six Sigma
Understanding carrying costs as a financial metric and as a target for DMAIC improvement projects is a core supply chain competency in Lean Six Sigma training. Green Belts and Black Belts working in manufacturing, distribution, and service environments regularly encounter excess inventory as a waste category in their DMAIC projects.
At Six Sigma Development Solutions, our Green Belt and Black Belt programs cover inventory waste, value stream mapping, and the full DMAIC toolkit for supply chain improvement.
We offer training in three formats:
- Onsite training — Delivered at your facility, using your actual inventory data and supply chain in value stream mapping exercises.
- Live virtual training — Instructor-led sessions delivered online, covering Lean waste identification, carrying cost analysis, and DMAIC project applications.
- Online training — Self-paced Green Belt and Black Belt certification programs covering all IASSC-testable Lean and supply chain content.
Explore our Six Sigma training programs or contact our team to find the right program for your goals.
About Six Sigma Development Solutions, Inc.
Six Sigma Development Solutions, Inc. offers onsite, public, and virtual Lean Six Sigma certification training. We are an Accredited Training Organization by the IASSC (International Association of Six Sigma Certification). We offer Lean Six Sigma Green Belt, Black Belt, and Yellow Belt, as well as LEAN certifications.
Book a Call and Let us know how we can help meet your training needs.


