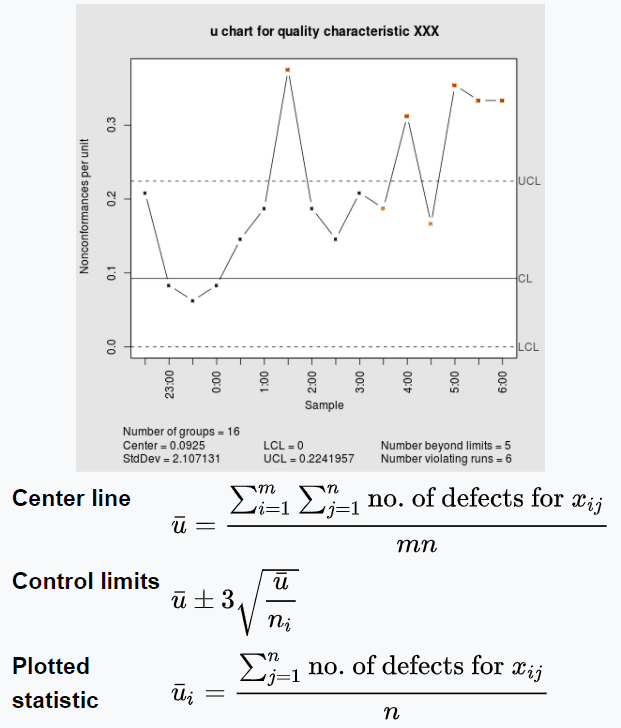
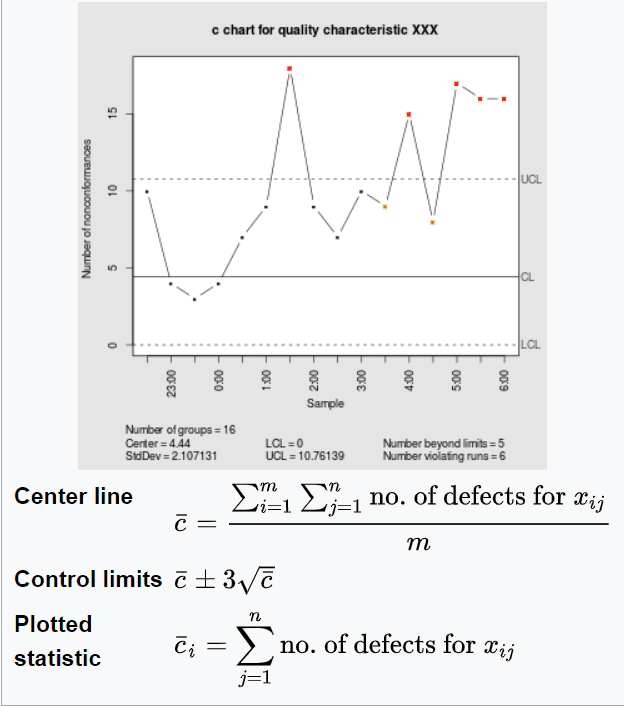
C & U charts are control charts for defects in quality control.
In statistical quality control, the c-chart is a type of control chart used to monitor “count”-type data, typically total number of defectives per unit. It is also occasionally used to monitor the total number of events occurring in a given unit of time.
The c-chart differs from the p-chart in that it accounts for the possibility of more than one defect per inspection unit, and that (unlike the p-chart and u-chart) it requires a fixed sample size. The p-chart models “pass”/”fail”-type inspection only, while the c-chart (and u-chart) give the ability to distinguish between (for example) 2 items which fail inspection because of one fault each and the same two items failing inspection with 5 faults each; in the former case, the p-chart will show two non-conformant items, while the c-chart will show 10 faults.
In statistical quality control, the u-chart is a type of control chart used to monitor “count”-type data where the sample size is greater than one, typically the average number of defectives per unit.
The u-chart differs from the c-chart in that it accounts for the possibility that the number or size of inspection units for which defectives are to be counted may vary. Larger samples may be an economic necessity or may be necessary to increase the area of opportunity in order to track very low defects levels.
Related SSDSI Articles:
References
Wikipedia. “u-chart”. Retrieved from https://en.wikipedia.org/wiki/U-chart
Wikipedia. “c-chart”. https://en.wikipedia.org/wiki/C-chart


