
Attribute charts represent a specialized category of statistical process control tools designed specifically for qualitative data analysis. Unlike variable control charts that track measurable characteristics such as length, weight, or temperature, attribute control charts monitor discrete, countable features that exist in binary states.
These powerful tools excel at tracking defects, non-conformances, and other quality characteristics that cannot be measured on continuous scales. Manufacturing environments frequently employ attribute charts to monitor paint defects, missing components, or functional failures that either occur or don’t occur without degrees of severity.
The beauty of attribute control charts lies in their simplicity and universal applicability. Quality teams can implement these tools across diverse industries, from healthcare monitoring patient safety incidents to software development tracking bug occurrences. This versatility makes attribute charts indispensable components of comprehensive quality management systems.
Table of contents
What Is an Attribute Chart?
An attribute chart, also known as an attribute control chart, is a statistical tool used to monitor the quality of a process by analyzing attribute data—data that is counted, not measured. Unlike variable data, which involves continuous measurements like weight or length, attribute data is categorical, often falling into “pass/fail” or “defective/non-defective” categories.
Think of it as a spotlight that highlights defects, errors, or non-conformities in a process, helping businesses maintain consistency and quality.
Picture a factory producing widgets. Instead of measuring each widget’s dimensions, you count how many are defective. An attribute chart tracks these counts over time, revealing patterns and signaling when a process needs attention. By focusing on discrete data, attribute charts offer a simple yet powerful way to ensure quality without complex measurements.

Public, Onsite, Virtual, and Online Six Sigma Certification Training!
- We are accredited by the IASSC.
- Live Public Training at 52 Sites.
- Live Virtual Training.
- Onsite Training (at your organization).
- Interactive Online (self-paced) training,
Types of Attribute Control Charts
Attribute charts come in several flavors, each tailored to specific types of data and scenarios. Let’s break down the most common ones:
1. P Chart (Proportion Defective Chart)
The p chart tracks the proportion of defective items in a sample. It’s ideal when sample sizes vary, such as inspecting different batches of products daily. For example, a bakery might use a p chart to monitor the percentage of loaves with baking defects.
- Use Case: Variable sample sizes, proportion of defects.
- Example: Tracking the percentage of defective circuit boards in daily production.
2. NP Chart (Number of Defectives Chart)
The np chart focuses on the number of defective items in a fixed-size sample. Unlike the p chart, it doesn’t calculate proportions—it counts defects directly. This makes it perfect for consistent sample sizes.
- Use Case: Fixed sample sizes, counting defective items.
- Example: Monitoring the number of flawed bottles in a batch of 100.
3. C Chart (Count of Defects Chart)
The c chart tracks the number of defects per unit, where a unit could have multiple defects. It assumes a constant sample size and is used when defects are counted, not items.
- Use Case: Counting defects in a single unit, constant sample size.
- Example: Counting scratches on a car’s surface during inspection.
4. U Chart (Defects per Unit Chart)
The u chart measures the average number of defects per unit when sample sizes vary. It’s similar to the c chart but adjusts for fluctuating sample sizes.
- Use Case: Variable sample sizes, defects per unit.
- Example: Tracking errors per page in documents of varying lengths.
Attribute Data Can Be Tracked on What Type of Control Chart
Understanding which type of control chart suits specific attribute data requires careful analysis of data characteristics and monitoring objectives. The question “attribute data can be tracked on what type of control chart” encompasses several decision factors.
Data Type Analysis forms the foundation of chart selection. Binary data classifying units as conforming or non-conforming suggests P or NP charts, while countable defects within units indicate C or U charts. The distinction between unit classification and defect counting drives this fundamental decision.
Sample Size Consistency influences chart selection significantly. Constant sample sizes enable simpler NP or C charts, while variable sample sizes necessitate P or U charts that accommodate size variations through proportional calculations.
Inspection Opportunity affects the choice between defect-based and unit-based charts. Fixed inspection areas or time periods suit C charts, while variable opportunities require U chart normalization. Understanding inspection scope helps determine appropriate monitoring approaches.
Reporting Requirements also influence chart selection. Management teams preferring percentage reports often favor P charts, while operations staff might prefer absolute counts from NP or C charts. Communication needs should align with chart selection decisions.
Comparing Attribute Charts: P Chart vs. NP Chart, C Chart vs. U Chart
Choosing the right attribute chart can feel like picking the perfect tool from a toolbox. Here’s a quick comparison to clarify:
P Chart vs. NP Chart
- P Chart: Tracks the proportion of defectives, ideal for varying sample sizes. It’s flexible and widely used in Six Sigma projects.
- NP Chart: Counts the number of defectives in fixed sample sizes, offering simplicity when consistency is key.
- When to Choose: Use a p chart for variable sample sizes; opt for an np chart when sample sizes are constant.
C Chart vs. U Chart
- C Chart: Counts total defects per unit with a fixed sample size. It’s great for processes where defects are rare but possible.
- U Chart: Tracks defects per unit with varying sample sizes, adjusting for differences in inspection scope.
- When to Choose: Pick a c chart for consistent sample sizes; use a u chart when sample sizes fluctuate.
NP Chart vs. P Chart vs. U Chart
- NP vs. P Chart: NP charts focus on raw counts of defectives, while p charts calculate proportions. NP is simpler but less flexible.
- U Chart vs. P Chart: U charts focus on defects per unit, while p charts track defective items. Use u charts for multiple defects per unit, p charts for overall defect rates.
This clarity ensures you select the right chart for your data, maximizing its effectiveness in quality control.
Also Read: Spider Chart
Why Use Attribute Charts?
Attribute charts are the unsung heroes of quality management for several reasons:
- Simplicity: They work with straightforward count data, requiring no complex measurements.
- Real-Time Insights: By plotting data over time, they highlight trends and anomalies, enabling quick interventions.
- Versatility: From manufacturing to healthcare, attribute charts apply to any process with categorical data.
- Six Sigma Alignment: They’re a staple in Six Sigma methodologies, supporting data-driven process improvements.
For instance, a hospital might use a u chart to track medication errors per patient visit, catching issues before they escalate. Similarly, a software company could use a p chart to monitor the proportion of buggy code releases, ensuring quality stays high.
Which Data Are Measured Using Attributes?
Attribute data is non-continuous, often binary or categorical. Examples include:
- Defective vs. non-defective products
- Pass/fail test results
- Errors in a document (e.g., typos, formatting issues)
- Customer complaints per order
- Presence/absence of a feature
These are tracked on control charts for attributes, such as p, np, c, or u charts, depending on the data type and sample size.
How to Create an Attribute Control Chart
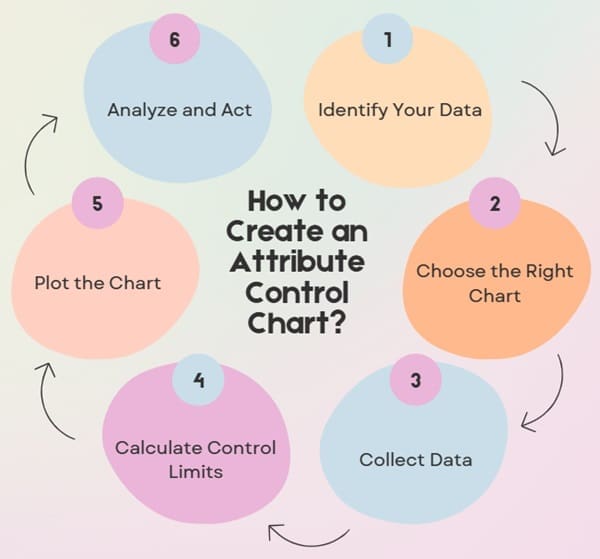
Ready to harness the power of attribute charts? Here’s a step-by-step guide to creating one:
Step 1: Identify Your Data
Determine the type of attribute data you’re tracking (e.g., defective items, defects per unit) and whether sample sizes vary.
Step 2: Choose the Right Chart
Select the appropriate chart (p, np, c, or u) based on your data and sample size consistency. Refer to the comparisons above for guidance.
Step 3: Collect Data
Gather attribute data over time. For example, count defective items daily or defects per unit in each batch.
Step 4: Calculate Control Limits
Use statistical formulas to set upper and lower control limits. These define the range of normal variation, helping you spot outliers. Software like Minitab or Excel can simplify this.
Step 5: Plot the Chart
Plot your data points on the chart, along with the control limits and centerline (average). Visual tools like control charts make trends easy to spot.
Step 6: Analyze and Act
Monitor the chart for points outside control limits or unusual patterns (e.g., runs or trends). Investigate and address root causes to improve the process.
Also Read: Radar Chart
Implementing Attribute Charts
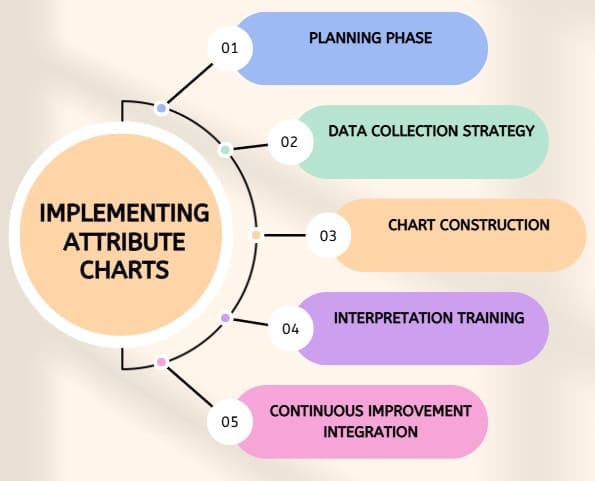
Successful attribute chart implementation requires systematic approaches that ensure accurate data collection, appropriate chart selection, and meaningful interpretation. Following proven methodologies increases the likelihood of achieving sustainable process improvements.
Planning Phase begins with clearly defining the attribute being measured and establishing operational definitions. Teams must specify exactly what constitutes a defect or non-conformance, ensuring consistent classification across all inspectors and time periods.
Data Collection Strategy involves determining sample sizes, inspection frequencies, and data recording methods. Attribute charts typically require larger sample sizes than variable charts to achieve adequate statistical power. Planning prevents inadequate data that compromises chart effectiveness.
Chart Construction follows established statistical formulas for control limit calculations. Each chart type uses specific mathematical approaches that account for data characteristics and sampling methods. Proper calculations ensure valid statistical interpretations.
Interpretation Training ensures team members understand chart signals and appropriate responses. Attribute charts provide different information than variable charts, requiring adjusted interpretation skills and reaction protocols.
Continuous Improvement Integration connects chart signals with problem-solving activities. Effective attribute chart programs trigger investigation and corrective action processes that address root causes rather than symptoms.
Practical Applications of Attribute Charts
Attribute charts shine in real-world scenarios across industries:
- Manufacturing: A car manufacturer uses a c chart to track paint imperfections per vehicle, ensuring flawless finishes.
- Healthcare: A clinic employs a p chart to monitor the proportion of patient records with errors, improving documentation accuracy.
- Retail: A store uses a u chart to track customer complaints per transaction, identifying service gaps.
- Software Development: A tech firm applies an np chart to count buggy releases in fixed-size code batches, enhancing product reliability.
These examples show how attribute charts turn raw counts into actionable strategies, driving quality and efficiency.
Challenges of Using Attribute Charts
While powerful, attribute charts aren’t without challenges:
- Data Quality: Inaccurate or inconsistent data collection can skew results.
- Sample Size Sensitivity: P and u charts require careful handling of varying sample sizes to avoid misinterpretation.
- Interpretation Skills: Teams need training to read and act on chart signals effectively.
Overcoming these hurdles involves clear data protocols, statistical training, and regular chart reviews.
Attribute Charts in Six Sigma
In Six Sigma, attribute charts are vital for process improvement. The p chart in Six Sigma is particularly popular, as it aligns with the methodology’s focus on reducing defects and variability. By integrating attribute charts into DMAIC (Define, Measure, Analyze, Improve, Control) projects, teams can pinpoint issues, implement solutions, and monitor results.
For example, a Six Sigma team might use a p chart to reduce defective product rates from 5% to 1%, saving costs and boosting customer satisfaction.
Advanced Applications and Six Sigma Integration
Modern quality management systems integrate attribute charts with comprehensive improvement methodologies, particularly Six Sigma approaches that demand statistical rigor and data-driven decision making.
Six Sigma projects frequently employ attribute charts during the Control phase to monitor improvement sustainability. After implementing solutions to reduce defect rates, teams use P charts or U charts to verify that improvements persist over time and detect any process degradation.
DMAIC Integration leverages attribute charts across multiple project phases. Define phase activities establish attribute measurement criteria, Measure phase efforts collect baseline data, Analyze phase work identifies patterns, Improve phase implementations track progress, and Control phase monitoring ensures sustainability.
Statistical Significance considerations become crucial when attribute charts support Six Sigma initiatives. Teams must understand confidence levels, statistical power, and sample size requirements to make valid conclusions about process performance and improvement effectiveness.
Cost of Quality calculations often rely on attribute chart data to quantify improvement benefits. Reducing defect rates tracked through attribute charts directly translates to lower costs of poor quality, providing financial justification for improvement investments.
FAQs About Attribute Charts
What is an attribute chart?
An attribute chart is a statistical tool used to monitor process quality by tracking categorical data, such as defects or errors, over time.
What type of data is tracked on attribute control charts?
Attribute data, which is counted rather than measured, includes defective items, pass/fail results, or errors per unit.
Which of the following are measured using attributes?
Defective products, customer complaints, errors in documents, and pass/fail outcomes are measured using attributes.
What’s the difference between a p chart and an np chart?
A p chart tracks the proportion of defectives in varying sample sizes, while an np chart counts defectives in fixed sample sizes.
How do c charts and u charts differ?
C charts count defects per unit with constant sample sizes, while u charts track defects per unit with varying sample sizes.
Conclusion
Attribute charts are the backbone of effective quality control, offering a clear, data-driven way to monitor and improve processes. From p charts in Six Sigma to c charts in manufacturing, these tools empower businesses to spot defects, reduce waste, and deliver consistent quality.
By choosing the right chart—whether p, np, c, or u—and following a structured approach, organizations can transform raw counts into strategic insights. As industries evolve, attribute charts remain a timeless ally in the quest for excellence. Embrace them, and watch your processes thrive.


