
Most hypothesis tests in Six Sigma are built around an assumption: your data follows a normal distribution. The 1-sample t-test, for example, compares a sample mean to a target value — but it requires that the underlying data is roughly normally distributed to produce reliable results.
What happens when your data is not normal?
That is where nonparametric tests come in. The 1-sample sign test is one of the simplest and most widely applicable. It does not assume any particular distribution shape. It tests whether the median of a sample matches a target value, using nothing more than the count of observations above and below that target.
This article explains what the 1-sample sign test is, when to use it, how to run it step by step, how it compares to related tests, and where it fits in a Six Sigma DMAIC project.
Table of contents
What Is the 1-Sample Sign Test?
The 1-sample sign test is a nonparametric hypothesis test used to determine whether the median of a single sample is equal to a specified target value.
It works by classifying each observation in your sample as either above (+) or below (-) the hypothesized median. Observations that equal the target exactly are removed from the analysis. The test then evaluates whether the number of positive signs and negative signs is consistent with what you would expect if the true median actually equaled the target — roughly half above, half below.
Because the test only uses the direction of each observation relative to the target (above or below), not the actual numeric distance, it is robust to outliers and skewed distributions. It requires no assumption about the shape of the data, only that the observations are independent and drawn from a continuous distribution.
The test was first used by John Arbuthnot, a Scottish physician, in 1710, making it one of the oldest documented statistical tests. Arbuthnot applied a similar sign-based logic to analyze birth records — an early example of using data to test a hypothesis about a population parameter.

Public, Onsite, Virtual, and Online Six Sigma Certification Training!
- We are accredited by the IASSC.
- Live Public Training at 52 Sites.
- Live Virtual Training.
- Onsite Training (at your organization).
- Interactive Online (self-paced) training,
When to Use the 1-Sample Sign Test
The 1-sample sign test is the right choice in a specific set of circumstances. Choosing it correctly requires understanding both when it applies and when a more powerful alternative should be used instead.
Use the 1-sample sign test when:
Your data does not follow a normal distribution, and you cannot reasonably transform it to normality. This is the primary reason to reach for a nonparametric test in the first place.
Your data is measured on an ordinal scale. Ordinal data has a meaningful order (like customer satisfaction ratings of 1 to 5) but the intervals between values may not be equal. The sign test handles ordinal data well because it only requires being able to say whether an observation is above or below a target.
Your sample is small and you have reason to doubt normality. With very small samples, normality tests themselves lack power. If the process is known to produce skewed output, the sign test is a defensible choice.
You have outliers that you cannot remove or correct. Because the sign test ignores the size of deviations and only counts their direction, extreme values do not distort the result the way they can in parametric tests.
Your data is from two dependent samples and you want to test the median of the paired differences. This is the paired version of the sign test.
Do not use the 1-sample sign test as a first resort. When your data is continuous, reasonably normal, and free of extreme outliers, the 1-sample t-test is more powerful — it uses more of the information in the data and will detect real differences with a smaller sample. Use the sign test when the assumptions for parametric testing genuinely cannot be met.
Also Read: What is Sample Mean?
Assumptions of the 1-Sample Sign Test
The sign test is nonparametric, which means it does not require normality. But it is not assumption-free. Three conditions must hold:
1. Random, independent sample. Each observation must come from a random sample and must be independent of the others. Observations from the same unit measured twice, or observations that influence each other, violate this assumption.
2. Continuous or ordinal data. The variable being tested must be measurable in a way that allows you to classify each observation as above or below the target. Nominal data (categories with no inherent order) does not qualify.
3. The median, not the mean, is the parameter of interest. The sign test tests the median. If your question is about the mean of the process, a different test is needed — either a 1-sample t-test (if normal) or a 1-sample Wilcoxon signed-rank test (if non-normal but symmetric).
Hypotheses for the 1-Sample Sign Test
Like all hypothesis tests, the sign test begins with a null hypothesis and an alternative hypothesis. The target median value is denoted as M₀.
Two-tailed test (the most common):
- H₀: Median = M₀
- Hₐ: Median ≠ M₀
Use this when you want to detect whether the median is different from the target in either direction — higher or lower.
Right-tailed test:
- H₀: Median ≤ M₀
- Hₐ: Median > M₀
Use this when your hypothesis is specifically that the median is higher than the target.
Left-tailed test:
- H₀: Median ≥ M₀
- Hₐ: Median < M₀
Use this when your hypothesis is specifically that the median is lower than the target.
Also Read: 2-Sample t-Test
How the 1-Sample Sign Test Works: Step by Step
The mechanics of the sign test are straightforward. Here is the process from data to decision.
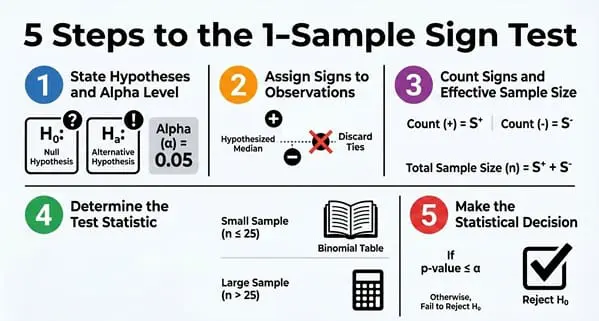
Step 1 — State the hypotheses. Define your null and alternative hypothesis and select your alpha level (typically 0.05).
Step 2 — Assign signs to each observation. Compare each data point to the hypothesized median M₀:
- If the observation is greater than M₀, assign a plus sign (+)
- If the observation is less than M₀, assign a minus sign (-)
- If the observation equals M₀ exactly, discard it and reduce the effective sample size by one
Step 3 — Count the signs. Count the total number of plus signs (call this S⁺) and minus signs (call this S⁻). Your effective sample size n is the total number of remaining observations (excluding ties).
Step 4 — Determine the test statistic. For small samples (n ≤ 25), the test statistic is the smaller of S⁺ and S⁻ for a two-tailed test. Compare this to the critical value from a binomial sign test table at your chosen alpha level and effective sample size.
For large samples (n > 25), a normal approximation is used. The test statistic is calculated as:
Z = (S − (n/2)) ÷ √(n/4)
Where S is the count of the less frequent sign (for a two-tailed test). Compare the absolute value of Z to the critical Z value for your alpha level (1.96 for a two-tailed test at alpha = 0.05).
Step 5 — Make the decision. If the test statistic falls in the rejection region (p-value ≤ alpha), reject the null hypothesis. Conclude that the sample median is statistically different from M₀. If the p-value exceeds alpha, fail to reject the null.
In practice, most Six Sigma practitioners run the sign test in statistical software such as Minitab, JMP, or SigmaXL, which calculate the p-value directly without requiring manual table lookup.
A Worked Example
A process improvement team is reviewing customer wait times at a service center. The target median wait time is 10 minutes. Historical data has been right-skewed due to occasional long waits, so the team opts for the 1-sample sign test rather than a t-test.
They collect a random sample of 15 wait times (in minutes):
7, 12, 9, 8, 14, 11, 6, 13, 10, 8, 15, 7, 11, 9, 12
Step 1: H₀: Median = 10 minutes; Hₐ: Median ≠ 10 minutes; alpha = 0.05
Step 2: Assign signs relative to M₀ = 10:
- Below 10 (−): 7, 9, 8, 6, 8, 7, 9 → 7 minus signs
- Above 10 (+): 12, 14, 11, 13, 15, 11, 12 → 7 plus signs
- Equal to 10: 10 → discarded
Step 3: Effective n = 14. S⁺ = 7, S⁻ = 7
Step 4: Test statistic = min(7, 7) = 7. At n = 14 and alpha = 0.05 (two-tailed), the critical value from sign test tables is 2. Since the test statistic (7) is greater than the critical value (2), the result does not fall in the rejection region.
Step 5: Fail to reject H₀. The data does not provide sufficient evidence that the median wait time differs from 10 minutes. The team should collect more data or investigate whether the process mean, not just the median, is the more useful metric to monitor.
1-Sample Sign Test vs. 1-Sample Wilcoxon Signed-Rank Test
These two tests are closely related. Both are nonparametric. Both test the median against a target. Also, both are alternatives to the 1-sample t-test when normality fails. The key difference is statistical power.
The 1-sample Wilcoxon signed-rank test is more powerful than the 1-sample sign test for most data sets. This is a critical point that is commonly misunderstood.
The reason: the Wilcoxon test uses both the direction and the magnitude of each observation’s difference from the target. It ranks the absolute differences and incorporates those ranks into the test statistic. This means it extracts more information from the same data set, which translates directly to higher power — a better ability to detect a real difference when one exists.
The sign test, by contrast, uses only direction (above or below the target). It discards information about how far above or below each observation sits.
So when should you prefer the sign test over the Wilcoxon?
When the distribution of your data is not symmetric around the median. The 1-sample Wilcoxon signed-rank test requires that the data be symmetric about the median — it is appropriate when the distribution is non-normal but roughly symmetric. When the distribution is skewed (asymmetric), the Wilcoxon’s additional assumption is violated, and the sign test — which requires no symmetry assumption — becomes the more appropriate choice.
A quick summary of the decision rule:
- Data is normal → use the 1-sample t-test
- Data is non-normal but symmetric → use the 1-sample Wilcoxon signed-rank test (more powerful)
- Data is non-normal and skewed, or ordinal → use the 1-sample sign test
1-Sample Sign Test vs. 1-Sample T-Test
Both tests address the same fundamental question: does this sample come from a population with a specific central value? But they measure different things and require different conditions.
The 1-sample t-test tests the mean. It is parametric and assumes the data follows a normal distribution (or that the sample is large enough for the Central Limit Theorem to apply). It is the more powerful test when its assumptions are met.
The 1-sample sign test tests the median. It is nonparametric and requires no distributional assumptions. It is less powerful when the data is normal but more appropriate when normality cannot be assumed.
A key practical point: when distributions are symmetric, the mean and median are equal. In those cases, a rejection of the null in a sign test and a rejection in a t-test are pointing at the same thing. When distributions are skewed, mean and median diverge, and the choice of test should reflect which central measure is actually meaningful for the process you are studying.
Where the 1-Sample Sign Test Fits in DMAIC
The sign test is primarily a tool for the Analyze and Improve phases of a DMAIC project, where hypothesis testing is used to validate root causes and confirm improvements.
Analyze phase: When investigating whether a process is meeting a target, the sign test provides a statistically valid way to test the median for non-normal data. For example: is the median processing time meeting the target? Is the median customer satisfaction score at or above the goal?
Improve phase: After implementing a change, the sign test can confirm whether the median of the improved process has shifted to a new target level. This is particularly useful in service processes, healthcare, and transactional environments where data is often non-normal or ordinal.
Measure phase: The sign test can also appear during baseline analysis, helping establish whether the current process median meets or misses a standard.
One important note: the sign test tests only the median, not the spread or shape of the distribution. If a project goal involves reducing variability as well as shifting the center, additional tests (variance tests or capability analysis) are needed alongside the sign test.
Running the 1-Sample Sign Test in Minitab
In Minitab, the 1-sample sign test is located under:
Stat > Nonparametrics > 1-Sample Sign
Select your data column, enter the hypothesized median value, and choose your alternative hypothesis (not equal, less than, or greater than). Minitab will output the confidence interval for the median, the number of points above and below the target, and the p-value for the test.
If you are using SigmaXL, the path is:
SigmaXL > Statistical Tools > Nonparametric Tests > 1-Sample Sign
Both tools produce the p-value directly, so no table lookup or manual calculation is required.
Learn Nonparametric Hypothesis Testing in Our Training Programs
The 1-sample sign test is part of the nonparametric hypothesis testing toolkit covered in our Green Belt and Black Belt programs. Knowing which test to use — and why the sign test, Wilcoxon, and t-test are not interchangeable — is a skill that comes from structured training, not just reading a definition.
At Six Sigma Development Solutions, we teach hypothesis test selection, assumptions checking, and result interpretation as integrated skills, applied across real project examples:
- Onsite training at your facility, with instruction tailored to your industry and data types
- Live virtual classroom with a live instructor, interactive exercises, and real-time Q&A
- Online self-paced certification you can complete on your own schedule
Our Green Belt program covers the full nonparametric toolkit — 1-sample sign, 1-sample Wilcoxon, Mann-Whitney, Kruskal-Wallis, and Mood’s Median test — alongside parametric methods so you can select and apply the right test for any data situation.
About Six Sigma Development Solutions, Inc.
Six Sigma Development Solutions, Inc. offers onsite, public, and virtual Lean Six Sigma certification training. We are an Accredited Training Organization by the IASSC (International Association of Six Sigma Certification). We offer Lean Six Sigma Green Belt, Black Belt, and Yellow Belt, as well as LEAN certifications.
Book a Call and Let us know how we can help meet your training needs.


