

ABC analysis, also known as Always Better Control, Pareto Analysis, or the 80:20 Rule, is a widely used inventory management technique. It prioritizes the management of inventory items based on their significance.
It is grounded in the economic principle formulated by the Italian economist Vilfredo Pareto. The principle states that a small percentage of items account for a large portion of the overall consumption value. This analysis is pivotal for effective inventory management, enabling businesses to allocate resources efficiently and focus on the most critical items.
Table of contents
- What is ABC Analysis?
- Explanation of ABC Analysis
- Classification of Items Under ABC
- Why ABC Analysis?
- Mechanism of ABC Analysis
- Management Policies for ABC Categorization
- Steps in ABC Analysis
- Example of ABC Analysis
- VED Analysis
- Difference Between ABC and VED Analysis
- Benefits of ABC Analysis
- Limitations of ABC Analysis
- Glossary
- Final Words
- Related Articles
What is ABC Analysis?
ABC analysis is a selective inventory control technique that categorizes inventory into three classes: A, B, and C. This categorization is based on the importance and consumption value of the items. The technique helps businesses prioritize their management efforts, ensuring that resources are allocated where they are most needed.
ABC Analysis is a method used to categorize inventory items into three groups: A, B, and C. These categories are determined based on the items’ significance, typically measured by their annual consumption value. The goal of ABC Analysis is to prioritize the management of inventory items, ensuring that the most valuable items receive the most attention.
Explanation of ABC Analysis
ABC Analysis is grounded in the Pareto Principle, which states that a small percentage of items (the “significant few”) account for the majority of the value, while a large percentage of items (the “insignificant many”) account for a small portion of the value.
This principle is applied to inventory management by categorizing items into A, B, and C classes based on their consumption value.
Classification of Items Under ABC
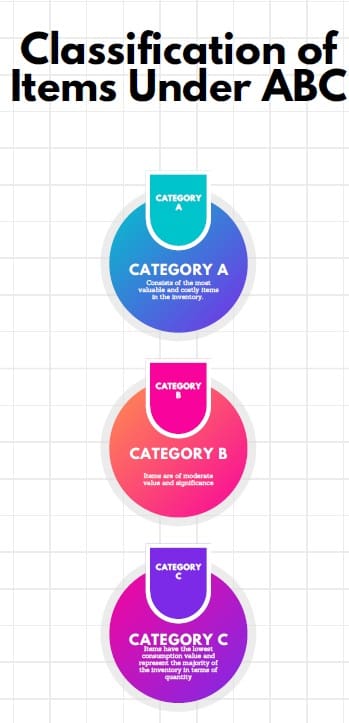
Category A
Category A consists of the most valuable and costly items in the inventory. These items have a high consumption value and typically represent a small percentage of the total inventory in terms of quantity but a large percentage in terms of value. For example, 10% of the items might account for 70% of the total investment in inventory. Therefore, these items require strict and careful control.
Category B
Category B items are of moderate value and significance. They are larger in number than Category A items but smaller in terms of monetary value. These items typically represent around 20% of the total inventory and account for about 20% of the total investment. Moderate control is needed for these items.
Category C
Category C items have the lowest consumption value and represent the majority of the inventory in terms of quantity but only a small portion in terms of value. For instance, 70% of the items might account for just 10% of the total investment. These items require loose control and minimal management oversight.
Why ABC Analysis?
ABC Analysis offers several benefits for inventory management:
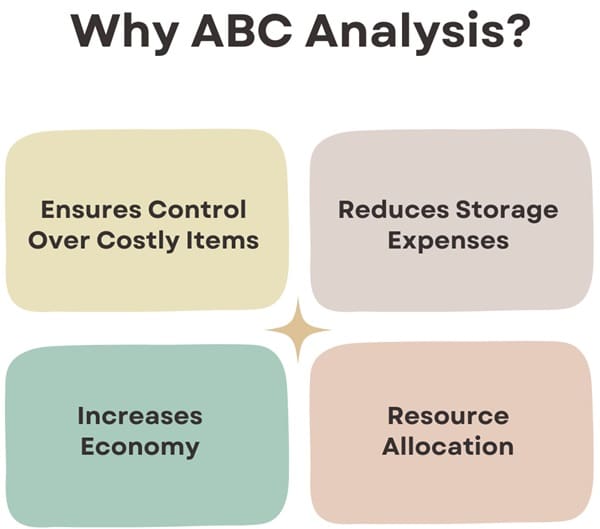
- Ensures Control Over Costly Items: Focusing on high-value items (Category A) ensures that businesses manage their most valuable assets effectively.
- Reduces Storage Expenses: Efficiently managing inventory reduces the need for excessive storage space, lowering storage costs.
- Resource Allocation: Helps allocate resources (time, money, effort) to the most critical items, enhancing overall efficiency.
- Increases Economy: Proper inventory management leads to cost savings and increased profitability.
Mechanism of ABC Analysis
- Determine Annual Consumption: Calculate the annual consumption of each item by multiplying the annual demand by the cost per unit.
- Calculate Annual Consumption Value: Multiply the annual quantity usage of each item by its cost per unit to find the total value in terms of annual usage.
- Categorize Items: Sort items in descending order based on their annual consumption value and classify them into categories A, B, and C.
Also See: Lean Six Sigma Certification Programs, Santa Ana, California
Management Policies for ABC Categorization
Different management strategies are applied to each category:
- A Items: Require very tight control, complete and accurate records, and frequent review using the Economic Order Quantity (EOQ) model.
- B Items: Need less stringent control, good records, and regular review.
- C Items: Require the simplest controls possible, minimal records, large inventories, and periodic review and reorder.
Steps in ABC Analysis
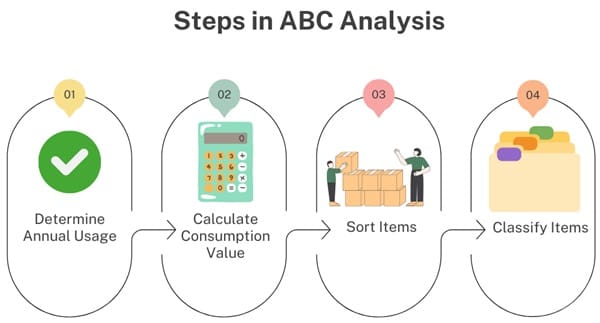
- Determine Annual Usage: Calculate the annual usage of each inventory item.
- Calculate Consumption Value: Multiply the annual usage by the cost per unit to find the total annual consumption value for each item.
- Sort Items: Arrange items in descending order based on their consumption value.
- Classify Items: Classify items into A, B, and C categories based on their consumption values.
Example of ABC Analysis
Consider the following table for an example of ABC Analysis:
| Item Stock Number | Percent of Number of Items Stocked | Annual Volume (units) x Unit Cost = Annual Consumption Value | Percent of Annual Consumption Value | Class |
| #10286 | 20% | 1,000 x $90.00 = $90,000 | 38.8% | A |
| #11526 | 500 x $154.00 = $77,000 | 33.2% | A | |
| #12760 | 1,550 x $17.00 = $26,350 | 11.3% | B | |
| #10867 | 30% | 350 x $42.86 = $15,001 | 6.4% | B |
| #10500 | 1,000 x $12.50 = $12,500 | 5.4% | B | |
| #12572 | 600 x $14.17 = $8,502 | 3.7% | C | |
| #14075 | 50% | 2,000 x $0.60 = $1,200 | 0.5% | C |
| #01036 | 100 x $8.50 = $850 | 0.4% | C | |
| #01307 | 1,200 x $0.42 = $504 | 0.2% | C | |
| #10572 | 250 x $0.60 = $150 | 0.1% | C |
VED Analysis
Introduce VED (Vital, Essential, Desirable) analysis alongside ABC Analysis for lean inventory management. This categorizes inventory based on criticality:
- Vital (V): Inventory without which the equipment stops working. No substitutes are allowed.
- Essential (E): Inventory that allows either a substitute or a variation.
- Desirable (D): Inventory that can have variations in both parameters.
Difference Between ABC and VED Analysis
| Aspect | ABC Analysis | VED Analysis |
| Basis of Classification | Based on annual consumption value or turnover of inventory items | Based on the criticality of items to the functioning of the organization |
| Categories | A (High-value items), B (Moderate-value items), C (Low-value items) | V (Vital items), E (Essential items), D (Desirable items) |
| Objective | To prioritize inventory management efforts based on financial significance | To ensure the availability of critical items required for operations |
| Focus | Cost control and investment optimization | Availability and reliability of essential items |
| Control Mechanism | Tighter control on high-value items (A), moderate control on B, and looser control on C items | Tighter control on vital items (V), moderate control on essential items (E), and looser control on desirable items (D) |
| Management Strategies | Frequent review and accurate records for A items; moderate review for B items; minimal review for C items | Frequent review and secure availability for V items; moderate review for E items; minimal review for D items |
| Applicability | Best suited for inventory with varied costs and consumption rates | Best suited for spare parts, maintenance supplies, and other critical operational items |
| Example Scenario | Retail stores, warehouses with diverse products | Hospitals, manufacturing plants, and other organizations where operational continuity is critical |
| Decision-Making Focus | Investment and financial impact | Operational impact and risk management |
| Replenishment Strategy | Economic Order Quantity (EOQ) model commonly used for A items | Stock levels and reorder points based on criticality |
| Data Requirement | Annual usage data, unit cost | Criticality assessment, risk analysis |
Benefits of ABC Analysis
ABC Analysis offers several advantages:
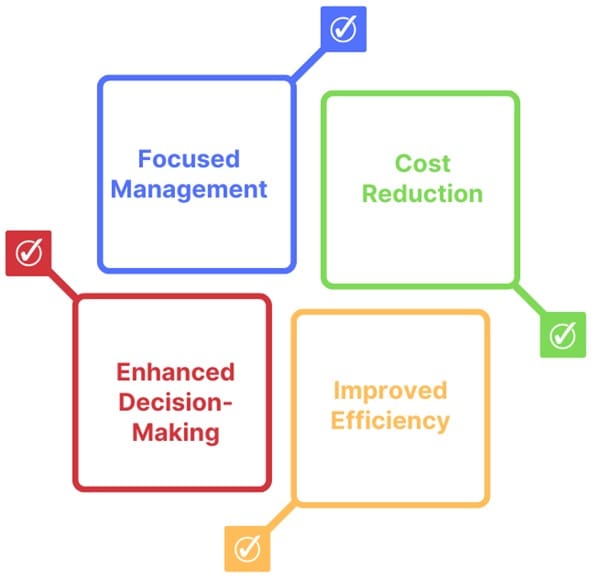
- Focused Management: Enables businesses to focus their efforts on the most critical items, ensuring better management and control.
- Cost Reduction: Helps reduce storage costs by managing inventory more efficiently.
- Improved Efficiency: Streamlines inventory management processes, leading to better resource allocation and increased profitability.
- Enhanced Decision-Making: Provides valuable insights into inventory usage patterns, aiding in informed decision-making.
Limitations of ABC Analysis
Despite its benefits, ABC Analysis has some limitations:
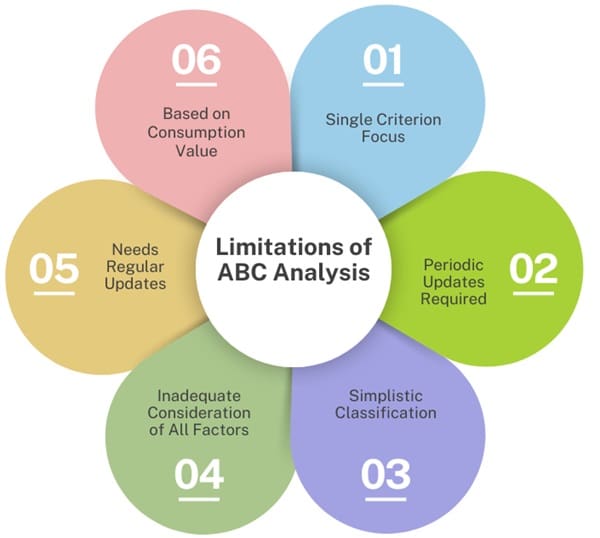
- Single Criterion Focus: Primarily focuses on consumption value, which might not consider other important factors such as lead time, item criticality, or obsolescence risk.
- Periodic Updates Required: Update the analysis regularly to reflect changes in consumption patterns, or its effectiveness will diminish.
- Simplistic Classification: The classification into only three categories can be overly simplistic, failing to capture the complexities of inventory management.
- Inadequate Consideration of All Factors: ABC Analysis primarily focuses on consumption value and may not consider other relevant factors such as lead time, item criticality, or obsolescence risk.
- Needs Regular Updates: Update the analysis periodically to reflect changes in consumption patterns; otherwise, its effectiveness will diminish.
- Based on Consumption Value: The classification is based on consumption value rather than unit value, which might not always accurately reflect an item’s importance.
Glossary
- ABC: Always Better Control, a selective inventory control technique.
- Pareto Principle: An economic principle stating that a small percentage of items contribute to a large percentage of the overall effect.
- Annual Consumption Value: The total value of items consumed annually, calculated as (Annual demand) × (Item cost per unit).
Final Words
ABC Analysis is a powerful tool for inventory management. By categorizing items based on their consumption value, businesses can focus their efforts on managing the most critical items, leading to better control, reduced costs, and increased efficiency.

About Six Sigma Development Solutions, Inc.
Six Sigma Development Solutions, Inc. offers onsite, public, and virtual Lean Six Sigma certification training. We are an Accredited Training Organization by the IASSC (International Association of Six Sigma Certification). We offer Lean Six Sigma Green Belt, Black Belt, and Yellow Belt, as well as LEAN certifications.
Book a Call and Let us know how we can help meet your training needs.


