
The Break-even Point (BEP) is a fundamental concept in financial analysis that helps businesses determine the minimum amount of sales needed to cover all costs—both fixed and variable—resulting in neither profit nor loss. It marks the level of output or sales where total revenue equals total costs.
Table of contents
Components of Break-Even Point (BEP) Analysis
Cost Classification:
- Fixed Costs: These are expenses that remain constant regardless of the level of production or sales. Examples include rent, salaries, insurance premiums, and lease payments.
- Variable Costs: These costs fluctuate with the level of production or sales. Examples include raw materials, direct labor costs, and sales commissions.
Revenue Determination:
- Total Revenue (TR): This is calculated as the product of the selling price per unit and the quantity of units sold.
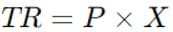
Where PPP is the price per unit and XXX is the number of units sold.
Total Cost Calculation:
- Total Cost (TC): Comprises both fixed and variable costs.

Here, FCFCFC represents fixed costs, VCVCVC denotes variable cost per unit, and XXX is the number of units sold.
Break-Even Calculation Methods
Algebraic or Equation Method:
- Unit Sales Break-Even Point:
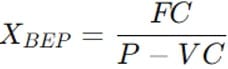
Where XBEPX_{BEP}XBEP is the break-even quantity, FCFCFC is fixed costs, PPP is selling price per unit, and VCVCVC is variable cost per unit.
- Revenue Break-Even Point:

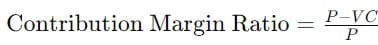
Contribution Margin Method:
- This method uses the concept of contribution margin, which is the selling price per unit minus the variable cost per unit.
- Unit Sales Break-Even:
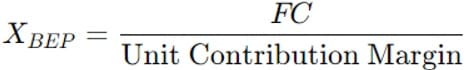
Where
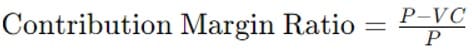
- Revenue Break-Even:
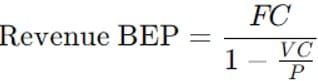
Where,
Graphic Method:
- Break-Even Chart: A graphical representation showing the relationship between total revenue, total cost, and profit or loss at various levels of output. It visually identifies the break-even point where the total revenue curve intersects with the total cost curve.
Assumptions of Break-Even Point (BEP)
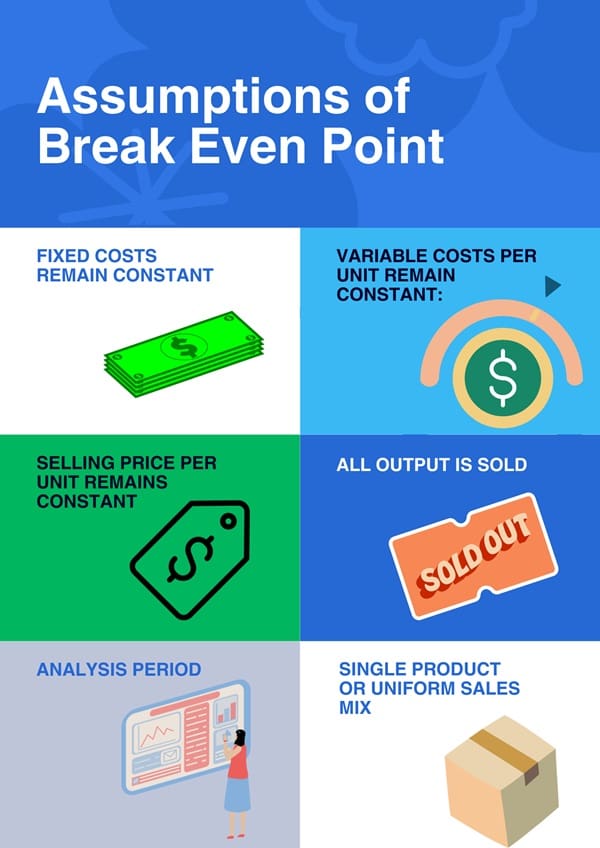
Break-even analysis relies on several key assumptions to provide a clear and useful estimation of the point at which revenues equal costs. These assumptions include:
- Fixed Costs Remain Constant: The analysis assumes that fixed costs do not change with changes in production or sales volume over the relevant range. Examples include rent, insurance, salaries of permanent staff, etc.
- Variable Costs Per Unit Remain Constant: It assumes that variable costs per unit of production remain unchanged regardless of the volume of output. Variable costs typically include raw materials, direct labor costs, and variable overhead costs directly tied to production.
- Selling Price Per Unit Remains Constant: The analysis assumes that the selling price per unit remains steady at all production levels. This assumption simplifies the calculation by assuming a stable pricing environment.
- All Output is Sold: It assumes that all units produced are sold. There is no consideration for potential unsold inventory or the impact of inventory levels on production costs.
- Analysis Period: The analysis typically focuses on a specific period, assuming that costs, prices, and production efficiencies remain relatively stable during that period.
- Single Product or Uniform Sales Mix: Break-even analysis assumes a uniform sales mix or a single product. This simplifies the calculation by avoiding complexities associated with varying product margins and sales contributions.
Importance of Break-Even Point (BEP) Analysis
- Decision Making: Helps businesses set pricing strategies and determine sales targets necessary to achieve profitability.
- Risk Assessment: Provides insights into financial risks associated with different levels of production and sales.
- Scenario Planning: Enables businesses to evaluate the impact of changes in costs, pricing, and sales volume on profitability.
- Capital Budgeting: Assists in assessing the feasibility of new projects or investments by estimating the level of sales required to cover costs.
Limitations of Break-Even Point (BEP)
- Assumption Dependency: Relies on fixed assumptions about costs, prices, and sales volume, which may not always reflect real-world variability.
- Simplicity vs. Realism: While simple in concept, real-world scenarios often involve complex cost structures and variable market conditions.
- Non-Linear Relationships: Break-even analysis assumes linear relationships between costs, prices, and volumes, which may not hold true in all situations.
Final Words
Break-even analysis is a powerful tool for businesses to assess their financial health and make informed decisions.
By understanding the break-even point, businesses can optimize pricing strategies, manage costs effectively, and plan for future growth. However, it’s essential to use break-even analysis in conjunction with other financial metrics and consider its limitations when making strategic decisions.


