
Defects per opportunity serves as one of the most powerful quality metrics in modern business operations. Organizations that master this measurement consistently deliver superior products and services while reducing costs and improving customer satisfaction. This comprehensive guide explores how you can leverage defects per opportunity to transform your quality management system.
Table of contents
What Is Defects Per Opportunity?
Defects per opportunity represents a quality metric that calculates the probability of defects occurring in any given process or product. This measurement divides the total number of defects by the total number of opportunities for defects to occur, providing a standardized way to assess and compare quality performance.
The metric originated in Six Sigma methodology but has expanded across industries as organizations recognize its value for quality improvement. Companies use it to establish baselines, set improvement targets, and track progress toward quality excellence.
Understanding defects per opportunity helps organizations identify problem areas, allocate improvement resources effectively, and communicate quality performance to stakeholders. The metric provides objective data that supports decision-making and drives continuous improvement efforts.
Modern quality management systems rely heavily on this because it normalizes quality measurements across different processes, products, and time periods. This standardization enables meaningful comparisons and benchmarking activities.

Public, Onsite, Virtual, and Online Six Sigma Certification Training!
- We are accredited by the IASSC.
- Live Public Training at 52 Sites.
- Live Virtual Training.
- Onsite Training (at your organization).
- Interactive Online (self-paced) training,
Understanding the Defects Per Opportunity Formula
Basic Calculation Method
Calculate defects per opportunity using this simple formula:
Defects Per Opportunity = Total Defects ÷ Total Opportunities.
This straightforward calculation provides immediate insights into quality performance levels.
Count every defect that occurs during the measurement period, regardless of severity or impact. Include both internal defects caught before delivery and external defects reported by customers or end users.
Determine the total number of opportunities by identifying every point where defects could potentially occur. This requires thorough process analysis and understanding of all possible failure modes.
Apply the formula consistently across measurement periods to ensure accurate trend analysis and performance comparison over time.
Opportunity Identification Process
Identify opportunities by examining each step in your process where defects could potentially occur. Map out all process stages, decision points, and quality checkpoints that represent defect opportunities.
Consider both obvious and subtle opportunities for defects. Obvious opportunities include assembly steps, data entry points, and customer interactions. Subtle opportunities might include communication handoffs, storage conditions, or environmental factors.
Document opportunity definitions clearly to ensure consistent measurement across different teams, locations, or time periods. Standardized definitions prevent confusion and enable accurate data collection.
Regularly review and update opportunity definitions as processes change or new failure modes are discovered. Process improvements often create new opportunities while eliminating others.
Data Collection Requirements
Establish robust data collection systems that capture defect information accurately and completely. Missing or inaccurate data undermines the reliability of DPO calculations.
Train personnel responsible for data collection to recognize and record defects consistently. Provide clear examples of what constitutes a defect versus normal variation or acceptable quality levels.
Implement verification procedures that validate data accuracy before calculating DPO. Regular audits help maintain data integrity and identify collection issues early.
Use technology tools like quality management software, statistical process control systems, or mobile data collection apps to streamline data gathering and reduce manual errors.
Applications of DPO Across Industries
Manufacturing Quality Control
Manufacturing organizations use defects per opportunity to monitor production quality, compare different product lines, and evaluate supplier performance. The metric helps identify which processes need immediate attention and resources.
Production teams calculate DPO for assembly operations, machining processes, testing procedures, and packaging activities. Each process step represents multiple opportunities for defects to occur.
Quality engineers use DPO data to prioritize improvement projects and allocate resources effectively. Processes with higher defect rates receive more attention and investment.
Supply chain managers apply defects per opportunity to evaluate vendor performance and make sourcing decisions. Suppliers with consistently low defect rates earn preferred status and expanded business opportunities.
Service Industry Implementation
Service organizations measure DPO in customer interactions, transaction processing, and service delivery activities. Each customer touchpoint represents opportunities for service defects.
Call centers track defects per opportunity across different types of customer inquiries, agent performance levels, and service resolution activities. This data drives training programs and process improvements.
Healthcare organizations use DPO to monitor patient care quality, medication administration accuracy, and clinical procedure effectiveness. The metric supports patient safety initiatives and regulatory compliance.
Financial services firms apply defects per opportunity to transaction processing, account management, and customer service operations. Accurate measurement helps maintain customer trust and regulatory compliance.
Software Development Quality
Software development teams use defects per opportunity to measure code quality, testing effectiveness, and release readiness. Each line of code, feature, or user story represents opportunities for defects.
Development teams calculate DPO for different modules, programming languages, and developer skill levels. This analysis identifies training needs and process improvement opportunities.
Quality assurance teams use defects per opportunity to evaluate testing coverage and effectiveness. Higher defect escape rates indicate gaps in testing processes or inadequate test case coverage.
Product managers leverage DPO data to make release decisions and prioritize bug fixes. Customer-facing defects typically receive higher priority than internal system issues.
Also Read: What are Defectives?
Benefits of Measuring Defects Per Opportunity
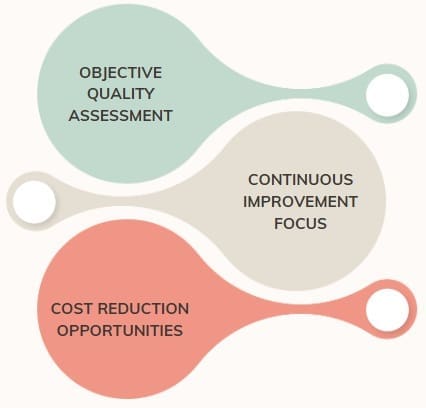
Objective Quality Assessment
Defects per opportunity provides objective, data-driven insights into quality performance that eliminate subjective opinions and biases. Numbers speak louder than assumptions or gut feelings about quality levels.
The metric enables fair comparisons between different processes, products, teams, or time periods. Standardized measurement removes variables that might otherwise skew quality assessments.
Organizations use DPO to establish performance baselines and track improvement progress over time. Trend analysis reveals whether quality initiatives are working effectively.
Stakeholders appreciate objective quality data because it supports informed decision-making and resource allocation. Clear metrics build confidence in quality management systems.
Continuous Improvement Focus
Defects per opportunity naturally drives continuous improvement efforts by highlighting areas with the highest improvement potential. Teams focus resources where they can achieve maximum impact.
The metric helps organizations set realistic improvement targets based on current performance levels and industry benchmarks. Achievable goals motivate teams and maintain improvement momentum.
Regular DPO measurement creates accountability for quality performance and encourages proactive problem-solving. Teams take ownership of their quality metrics and improvement results.
Organizations use defects per opportunity trends to validate improvement initiatives and adjust strategies when results don’t meet expectations. Data-driven adjustments improve success rates.
Cost Reduction Opportunities
Lower defects per opportunity directly translates to reduced costs through fewer rework activities, warranty claims, customer complaints, and quality failures. Quality improvements flow directly to the bottom line.
Organizations identify the most expensive defect categories and prioritize improvements based on cost impact. High-cost defects receive immediate attention and resources.
Defects per opportunity data helps justify investments in quality improvement initiatives by quantifying potential cost savings. Business cases become more compelling with solid quality data.
Preventive quality measures typically cost less than reactive defect correction. Defects per opportunity measurement encourages proactive quality management approaches.
Implementing Defects Per Opportunity Measurement
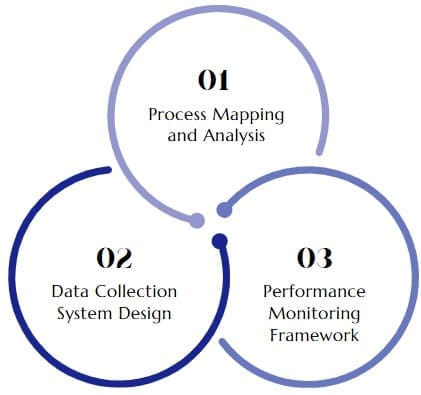
Process Mapping and Analysis
Begin implementation by mapping all processes where defects per opportunity measurement will apply. Detailed process maps identify every opportunity for defects to occur.
Analyze each process step to understand potential failure modes and their impact on overall quality. This analysis guides opportunity definition and data collection planning.
Engage process owners and frontline employees in mapping activities to capture detailed knowledge about how work actually gets done. Their insights improve measurement accuracy and buy-in.
Document process maps clearly and maintain them as processes change over time. Updated maps ensure that opportunity definitions remain accurate and relevant.
Data Collection System Design
Design data collection systems that capture defect information efficiently without creating excessive administrative burden. Simple, user-friendly systems encourage consistent data collection.
Integrate defects per opportunity measurement into existing quality management systems when possible. Leveraging current infrastructure reduces implementation costs and complexity.
Establish clear procedures for data collection, validation, and reporting. Written procedures ensure consistency across different teams and time periods.
Provide training for all personnel involved in data collection to ensure accurate and complete defect reporting. Regular refresher training maintains data quality over time.
Performance Monitoring Framework
Create dashboards and reports that make defects per opportunity performance visible to all stakeholders. Visual displays encourage attention and action when performance declines.
Establish performance thresholds that trigger investigation and improvement activities. Automated alerts help teams respond quickly to quality issues.
Schedule regular review meetings where teams analyze DPO trends and plan improvement actions. Consistent attention maintains focus on quality performance.
Compare performance against industry benchmarks and best practices when available. External comparisons provide context and improvement inspiration.
Also Read: DMAIC Vs PDCA
Improving Defects Per Opportunity Performance
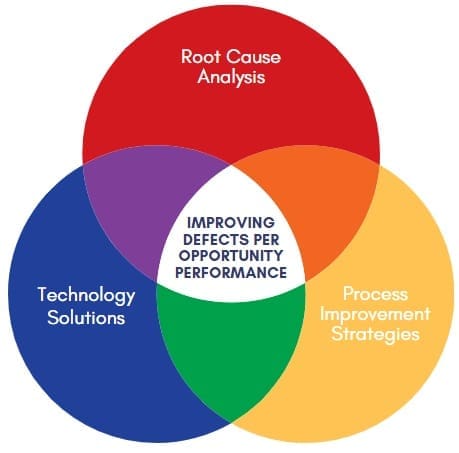
Root Cause Analysis
Conduct thorough root cause analysis when DPO performance deteriorates or fails to meet targets. Understanding why defects occur enables effective corrective actions.
Use structured problem-solving methodologies like fishbone diagrams, 5-why analysis, or failure mode and effects analysis to identify root causes systematically.
Involve cross-functional teams in root cause analysis to leverage diverse perspectives and expertise. Multiple viewpoints often reveal causes that individual analysis might miss.
Document root cause findings and corrective actions to prevent similar issues in the future. Organizational learning accelerates improvement efforts across similar processes.
Process Improvement Strategies
Implement process improvements that address the root causes of defects while maintaining operational efficiency. Focus on changes that provide maximum quality improvement for minimum disruption.
Consider error-proofing techniques that make defects impossible or immediately detectable. Prevention is more effective than detection and correction after defects occur.
Standardize processes to reduce variation and improve consistency. Standard operating procedures help maintain quality performance across different employees and situations.
Invest in employee training and development to improve skills and knowledge related to quality performance. Well-trained employees make fewer mistakes and catch more defects early.
Technology Solutions
Leverage technology tools that reduce opportunities for human error and improve defect detection capabilities. Automation can eliminate entire categories of potential defects.
Implement quality management software that streamlines data collection, analysis, and reporting for defects per opportunity measurement. Technology improves measurement accuracy and efficiency.
Use statistical process control tools that identify quality trends and anomalies before they result in defects. Predictive quality management prevents problems rather than reacting to them.
Deploy inspection technologies like machine vision, sensors, or automated testing that detect defects more consistently than manual inspection methods.
Advanced Applications and Techniques of DPO
Statistical Process Control Integration
Integrate defects per opportunity measurement with statistical process control charts to monitor quality performance over time. Control charts reveal whether process performance is stable or experiencing unusual variation.
Calculate control limits based on historical defects per opportunity data to establish normal operating ranges. Points outside control limits indicate special causes that require investigation.
Use different control chart types depending on your data characteristics and measurement frequency. P-charts work well for DPO data in most applications.
Train teams to interpret control charts correctly and respond appropriately to different types of signals. Proper interpretation prevents overreaction to normal variation and underreaction to real problems.
Benchmarking and Target Setting
Research industry benchmarks for DPO in similar processes or products. External benchmarks provide context for evaluating current performance levels.
Set improvement targets based on benchmarking data, organizational capabilities, and customer requirements. Realistic targets motivate improvement while unrealistic targets discourage effort.
Participate in industry associations or benchmarking consortiums that share quality performance data. Collaborative benchmarking provides valuable insights and improvement ideas.
Update targets regularly as performance improves and organizational capabilities develop. Progressive targets maintain improvement momentum and prevent complacency.
Multi-Level Analysis
Analyze defects per opportunity at multiple organizational levels to understand quality performance comprehensively. Different levels reveal different improvement opportunities and management needs.
Track defects per opportunity for individual operators, teams, departments, and entire organizations. Multi-level analysis identifies where problems originate and where improvements are needed.
Use hierarchical reporting that allows managers to drill down from high-level summaries to detailed operational data. Flexible reporting supports different management needs and decision-making requirements.
Establish accountability for DPO performance at appropriate organizational levels. Clear ownership encourages proactive quality management and improvement efforts.
Also Read: What is DPMO in Six Sigma
Common Implementation Challenges
Data Quality Issues
Ensure data accuracy and completeness throughout the measurement system. Poor data quality undermines defects per opportunity calculations and leads to incorrect conclusions about quality performance.
Address inconsistent defect definitions and opportunity counting across different teams or locations. Standardization is essential for meaningful measurement and comparison.
Implement data validation procedures that catch and correct errors before they affect defects per opportunity calculations. Regular audits help maintain data integrity over time.
Provide ongoing training for data collectors to maintain consistent and accurate defect reporting. Skills refresher sessions prevent measurement drift and maintain reliability.
Resource Allocation
Balance the resources required for defects per opportunity measurement against the benefits it provides. Excessive measurement overhead can consume resources better used for improvement activities.
Focus measurement efforts on the most critical processes and products where quality performance has the greatest impact on customer satisfaction and business results.
Automate data collection and analysis where possible to reduce manual effort and improve measurement efficiency. Technology investments often pay for themselves through reduced labor costs.
Integrate DPO measurement into existing quality systems and processes to minimize additional resource requirements while maximizing measurement value.
Change Management
Address resistance to DPO measurement by clearly communicating its benefits and importance. Help employees understand how quality measurement supports their success and the organization’s goals.
Involve employees in designing and implementing measurement systems to build ownership and buy-in. Participation increases acceptance and improves measurement accuracy.
Provide training and support to help employees adapt to new measurement requirements. Change management support reduces resistance and accelerates successful implementation.
Celebrate improvements in defects per opportunity performance to reinforce the value of quality measurement and maintain momentum for continuous improvement efforts.
Frequently Asked Questions
How do you calculate defects per opportunity?
Calculate defects per opportunity by dividing total defects by total opportunities. For example, if you have 15 defects out of 1,000 opportunities, your defects per opportunity equals 0.015 or 1.5%.
What constitutes an opportunity in defects per opportunity measurement?
An opportunity represents any point in a process where a defect could potentially occur. This includes assembly steps, data entry points, decision points, and any activity that could result in an error or failure.
How does defects per opportunity differ from defect rate?
Defects per opportunity normalizes quality measurement by considering the number of opportunities for defects, while defect rate simply counts defects per unit. This normalization enables better comparison across different processes.
What is a good defects per opportunity benchmark?
Benchmark levels vary by industry, but world-class performance typically achieves defects per opportunity rates below 0.001 (0.1%). Six Sigma quality levels target 3.4 defects per million opportunities.
How often should you measure defects per opportunity?
Measurement frequency depends on process characteristics and improvement needs. High-volume processes may require daily measurement, while low-volume processes might use weekly or monthly cycles.
Can defects per opportunity be used for service processes?
Yes, DPO applies effectively to service processes by identifying opportunities for service failures and measuring their occurrence rates. Examples include customer interaction errors or processing mistakes.
What tools help track defects per opportunity?
Quality management software, statistical process control systems, spreadsheet applications, and specialized Six Sigma tools all support DPO tracking and analysis.
How do you improve defects per opportunity performance?
Improve performance through root cause analysis, process standardization, error-proofing techniques, employee training, and technology implementation. Focus on preventing defects rather than just detecting them.
Final Words
Defects Per Opportunity (DPO) is a critical quality metric that helps organizations measure process performance by identifying how often errors occur relative to the total number of possible defect opportunities. By calculating and analyzing DPO, businesses can pinpoint inefficiencies, prioritize improvements, and drive higher quality outcomes.
When integrated with broader methodologies like Six Sigma or Lean, DPO serves as a powerful tool for reducing variation, minimizing waste, and enhancing customer satisfaction. Ultimately, maintaining a low DPO supports operational excellence and long-term competitive advantage.