Overall Equipment Effectiveness (OEE) is a crucial key performance indicator (KPI) used to measure and improve the efficiency of industrial equipment. It helps manufacturers evaluate how well their equipment is being utilized in terms of availability, performance, and quality.
These three elements give insight into potential productivity issues and assist in improving overall operational efficiency.
Overall Equipment Effectiveness (OEE) is a key metric used to assess and improve manufacturing performance, introduced as part of Total Productive Maintenance (TPM) by Seiichi Nakajima in the 1980s.
OEE serves as a tool to identify and measure losses in production related to equipment, providing insight into how efficiently a manufacturing process operates. It breaks down equipment effectiveness into three primary components: availability, performance, and quality.
Table of contents
What is OEE?
Overall Equipment Effectiveness (OEE) is a powerful tool for measuring and improving the productivity of manufacturing processes.
First introduced in the mid-1990s, OEE has become a globally accepted method for evaluating how efficiently manufacturing equipment is used. It is an essential metric for identifying potential areas of improvement in any manufacturing plant.
OEE provides insight into three primary components: Availability, Performance, and Quality. By analyzing these three areas, manufacturers can target the specific losses impacting productivity and take appropriate actions to improve their processes, ensuring higher efficiency and profitability.
Defining OEE
OEE is a quantitative metric that tracks and aims to reduce production losses. These losses, first identified by Nakajima (1989), are categorized into six types:
- Breakdowns (Equipment Failure): Time lost due to equipment malfunctions.
- Setup and Adjustments: Losses incurred during equipment setup or adjustment.
- Idling and Minor Stoppages: Interruptions that briefly halt production, such as jams or brief malfunctions.
- Reduced Speed or Speed Losses: When equipment runs slower than its optimal speed.
- Quality Defects: Losses due to defective products that do not meet quality standards.
- Rework: Time and resources spent fixing defects or producing products again.
OEE Ideal Values
Nakajima (1988) introduced the concept of a “world-class” OEE target of 85%, breaking it down into:
- Availability Rate: 90% (time the equipment is available to operate versus the scheduled operating time)
- Performance Rate: 95% (speed at which the equipment operates compared to its maximum speed)
- Quality Rate: 99% (proportion of products meeting quality standards versus total products produced)
These target values serve as benchmarks for manufacturing industries aiming to minimize losses and maximize productivity.
Components of OEE
OEE is calculated using the following formula:
OEE=Availability × Performance × Quality
Each component of this formula provides a specific perspective on the overall efficiency of the manufacturing process.
- Availability
Availability measures the actual time that a machine is operating compared to the total time it was available. It takes into account any downtime, including machine breakdowns, maintenance, or setups, that reduce the amount of time a machine is running. The formula for Availability is:

In simpler terms, Availability focuses on how much of the machine’s available production time was actually used for production, excluding planned and unplanned downtimes.
- Performance
Performance measures how efficiently a machine operates when it is running. It compares the number of parts produced to the ideal production rate for that machine. This metric highlights whether the machine is running at its maximum speed or slower due to issues like jams or inefficiencies. The formula for Performance is:

Performance reveals how well the machine is running when it’s in operation, helping to identify speed losses due to suboptimal conditions, equipment ageing, or operator inefficiencies.
- Quality
Quality measures the proportion of good parts produced compared to the total number of parts produced. This metric reflects how many parts meet production standards, helping to quantify losses due to defective or rejected products. The formula for Quality is:

Essentially, Quality assesses how many parts produced are usable, eliminating losses related to poor-quality output or rework.
OEE Terminology
To fully grasp how OEE operates, it’s important to understand the key terms used in OEE calculations:
- Run Time: This refers to the actual production time during which a machine is operating and producing parts.
- Setup Time: The period required to set up a machine before production, ensuring it is ready to produce good parts.
- Downtime: Any time the machine is unavailable for production due to breakdowns or maintenance.
- Total Time: This encompasses the total available time for the machine, including Run Time, Setup Time, and Downtime.
- Target Count: The expected number of parts a machine should produce within a given timeframe.
- Total Count: The actual number of parts, both good and bad, produced by the machine.
- Good Count: The number of parts that meet manufacturing specifications and are considered acceptable.
Purpose of OEE

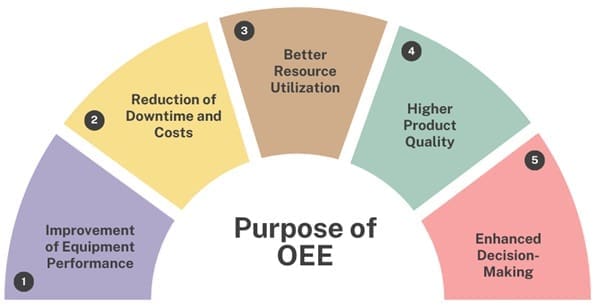
OEE serves several important purposes for manufacturers:
- Improvement of Equipment Performance: By monitoring OEE data, manufacturers can make informed decisions on maintenance schedules, operating procedures, and performance bottlenecks.
- Reduction of Downtime and Costs: OEE helps identify patterns in equipment downtime and can facilitate predictive maintenance, reducing repair costs and avoiding unexpected breakdowns.
- Better Resource Utilization: By optimizing machine performance, manufacturers can maximize their workforce productivity, ensuring that personnel are effectively utilized without overstaffing.
- Higher Product Quality: Tracking quality data at the equipment level enables managers to address issues with defective products, reducing scrap and rework, and improving customer satisfaction.
- Enhanced Decision-Making: OEE provides real-time insights into equipment performance, allowing plant managers to make timely decisions and reduce delays in addressing operational problems.
Categories of Loss in OEE

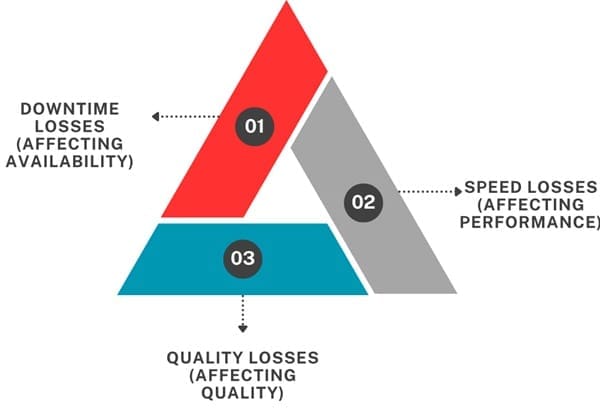
One of the primary benefits of OEE is its ability to categorize different types of losses that impact machine productivity. These losses fall into three main categories: Downtime Losses, Speed Losses, and Quality Losses. Each category affects one of the three OEE metrics, allowing manufacturers to pinpoint exactly where improvements are needed.
- Downtime Losses (Affecting Availability)
Downtime losses refer to periods when the machine is unavailable for production. Common causes include:- Equipment failures
- Tooling damage
- Unplanned maintenance
- Changeovers or material shortages
Reducing downtime is critical, as a machine that is not running cannot produce anything. Addressing these issues through regular maintenance, streamlined setups, and efficient resource management can significantly boost Availability.
- Speed Losses (Affecting Performance)
Speed losses occur when a machine is not running at its maximum possible speed. Factors that contribute to speed losses include:- Product misfeeds
- Component jams
- Operator inefficiencies
- Equipment aging or tooling wear
Reducing speed losses involves ensuring that machines are running at their ideal rate. Training operators, regularly maintaining equipment, and replacing worn tools can all help optimize performance.
- Quality Losses (Affecting Quality)
Quality losses refer to the production of defective or poor-quality parts. These losses can arise due to:- Tolerance adjustments
- Incorrect assembly
- Damage or rejects
Improving the quality of parts produced is essential for minimizing waste and rework. Careful monitoring of the production process, making timely adjustments, and conducting quality checks are key to reducing these losses.
OEE Calculation
OEE combines these three factors into a single percentage that reflects the overall performance of the equipment. The goal of calculating OEE is to provide a clear snapshot of how efficiently the equipment is operating and to highlight areas that require improvement.
- Formula: OEE = Availability × Performance × Quality × 100
For example, if a machine has 90% availability, 95% performance, and 99% quality, its OEE would be:
- OEE = 0.90 × 0.95 × 0.99 × 100 = 84.6%
A common misconception is that OEE offers a single “magic number” that summarizes performance, but in reality, each of its components offers valuable insight on its own.
Real-World Example of OEE Calculation
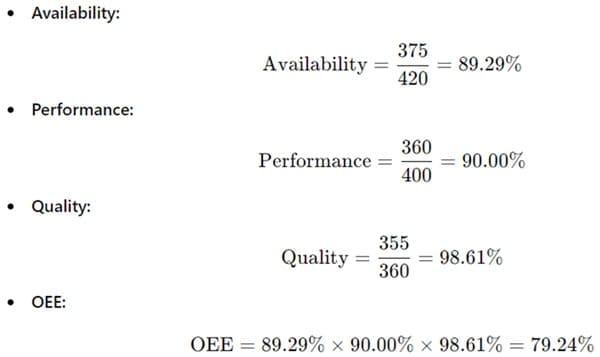
Let’s take an example to better understand how OEE is calculated in a real manufacturing environment. Imagine a machine has the following data for an 8-hour shift:
- Shift Length: 480 minutes
- Run Time: 375 minutes
- Breaks: 60 minutes
- Setup Time: 15 minutes
- Downtime: 30 minutes
- Total Parts Produced: 360
- Good Parts Produced: 355
- Target Parts: 400
Using this data, we can calculate the OEE metrics:

This OEE calculation provides a clear picture of where improvements can be made to increase overall productivity.
OEE Benchmarks
Nakajima (1988) introduced the concept of a “world-class” OEE target of 85%, breaking it down into:
- Availability Rate: 90% (time the equipment is available to operate versus the scheduled operating time)
- Performance Rate: 95% (speed at which the equipment operates compared to its maximum speed)
- Quality Rate: 99% (proportion of products meeting quality standards versus total products produced)
- Reaching these benchmarks allows manufacturers to compete on a global scale, but it’s important to remember that maintaining a high OEE requires continuous monitoring and adjustments. An OEE rating of 85% doesn’t automatically guarantee excellence if, for example, performance or quality is suboptimal.
Variations in OEE Benchmarks
While Nakajima’s target of 85% OEE is widely regarded as an ideal benchmark, various studies suggest that achieving this level consistently can be challenging. Research by Kotze (1993) presented a more realistic OEE target of greater than 50%, considering it more practical for industries. Similarly, Ljungberg (1998) proposed that OEE values between 60% and 75% are acceptable for many industries.
Ljungberg’s research found an average OEE of 55% across sample cases, which is significantly below the 85% target. This lower rate can largely be attributed to reduced performance, as equipment speed and minor stoppages often contribute to significant performance losses. Despite this, Ljungberg’s study observed an average availability rate of 80%, approaching Nakajima’s 90% target.
Performance losses remain the most significant contributor to OEE reductions. The average performance rate observed by Ljungberg was 68%, far below Nakajima’s suggested 95%, mainly due to idling and minor stoppages. However, the quality rate of 99% achieved in the study aligns with Nakajima’s world-class target.
Enterprise Benefits of OEE

Implementing an OEE system brings several benefits to an organization:
- Reduced Downtime Costs: Machines that frequently break down not only halt production but also increase operational costs. By tracking OEE, manufacturers can implement predictive maintenance to prevent unexpected failures, thereby reducing downtime and its associated costs.
- Lower Repair Costs: OEE data helps identify trends in equipment performance, allowing maintenance teams to predict and prevent failures before they occur. This proactive approach can lead to significant savings in repair costs, as issues are addressed before they become major problems.
- Increased Labor Efficiency: By optimizing equipment performance, OEE helps improve the productivity of the existing workforce. Managers can use OEE data to allocate resources more effectively and avoid unnecessary labor costs.
- Enhanced Quality Control: OEE captures data on product defects and rejects, providing insights into the root causes of quality issues. By addressing these problems early, manufacturers can reduce the costs associated with rework and scrap, and ultimately deliver higher-quality products to their customers.
- Improved Production Capabilities: As equipment performance improves and defects decrease, manufacturers can achieve higher production levels without the need for additional resources. This increase in output leads to greater profitability and competitiveness in the market.
- Data-Driven Decision Making: OEE systems provide real-time data on equipment performance, enabling managers to make informed decisions quickly. This helps manufacturers respond to issues as they arise and implement continuous improvements.
Improving OEE
Improving OEE requires a targeted approach to reduce losses in availability, performance, and quality. Each of these components must be analyzed individually, and improvement strategies should be developed based on the root causes of the identified losses. Below are some strategies for improving each aspect of OEE:
1. Improving Availability
To improve availability, manufacturers should focus on reducing equipment breakdowns and minimizing setup times. Strategies may include:
- Implementing preventive maintenance schedules to ensure equipment stays in good working condition.
- Using predictive maintenance tools to identify potential issues before they lead to breakdowns.
- Streamlining setup procedures and reducing setup times through better planning and organization.
2. Improving Performance
Performance improvements often involve reducing speed losses and preventing minor stoppages. Strategies include:
- Regularly inspecting equipment to ensure it operates at optimal speeds.
- Implementing training programs to ensure operators are well-versed in using the equipment efficiently.
- Analyzing production data to identify patterns of stoppages or slowdowns and addressing root causes.
3. Improving Quality
Quality improvements focus on reducing defects and rework. Strategies may involve:
- Enhancing quality control processes to catch defects early.
- Providing training to operators to ensure they follow best practices in production.
- Adjusting production processes to reduce variability and improve product consistency.
Challenges in Achieving High OEE
While OEE provides a powerful framework for measuring and improving production efficiency, achieving high OEE values is not always easy. Common challenges include:
- Complex Equipment: Some manufacturing processes involve highly complex equipment that is prone to breakdowns or difficult to optimize for performance.
- Variability in Raw Materials: Variations in the quality of raw materials can lead to inconsistent production and higher defect rates.
- Human Factors: Operator errors or insufficient training can contribute to performance and quality losses.
Final Words
Overall Equipment Effectiveness (OEE) is a powerful tool for improving the efficiency and productivity of manufacturing equipment. By focusing on the three core elements of availability, performance, and quality, manufacturers can identify areas for improvement and make informed decisions to optimize their processes. Implementing an OEE system provides numerous benefits, including reduced downtime, lower repair costs, better quality control, and increased production capabilities.
For any manufacturer looking to gain a competitive edge, OEE is an essential metric that can lead to significant improvements in operational efficiency and profitability. By continuously tracking and analyzing OEE data, manufacturers can ensure that their equipment is performing at its best and that they are maximizing the value of their resources.

About Six Sigma Development Solutions, Inc.
Six Sigma Development Solutions, Inc. offers onsite, public, and virtual Lean Six Sigma certification training. We are an Accredited Training Organization by the IASSC (International Association of Six Sigma Certification). We offer Lean Six Sigma Green Belt, Black Belt, and Yellow Belt, as well as LEAN certifications.
Book a Call and Let us know how we can help meet your training needs.


This article enables me to enhance my understanding, broaden my expertise, and further develop my skills. Thank you!