
Process flow diagrams serve as essential visual tools that transform complex business operations into clear, understandable roadmaps. These powerful diagrams enable organizations to analyze, optimize, and communicate their processes effectively while identifying bottlenecks, redundancies, and improvement opportunities.
Modern businesses rely on process flow diagrams to streamline operations, reduce costs, and enhance productivity across departments. Furthermore, these visual representations facilitate better communication between stakeholders, ensuring everyone understands how processes work and where improvements can be made.
Organizations implementing systematic process mapping through flow diagrams consistently achieve operational excellence while maintaining quality standards and meeting customer expectations.
Table of contents
Process Flow Diagrams
A process flow diagram represents a visual map that illustrates the sequence of steps, decisions, and activities within a specific process. These diagrams use standardized symbols and connecting lines to show how inputs transform into outputs through various stages.
The fundamental purpose of process flow diagrams involves documenting current processes, identifying improvement opportunities, and designing future state processes. Additionally, these diagrams serve as training tools, compliance documentation, and communication aids throughout organizations.
Process flow diagrams typically include start and end points, process steps, decision points, inputs and outputs, and directional flow indicators. Each component plays a critical role in creating comprehensive process documentation that supports continuous improvement initiatives.

Public, Onsite, Virtual, and Online Six Sigma Certification Training!
- We are accredited by the IASSC.
- Live Public Training at 52 Sites.
- Live Virtual Training.
- Onsite Training (at your organization).
- Interactive Online (self-paced) training,
Types of Process Flow Diagrams for Different Applications
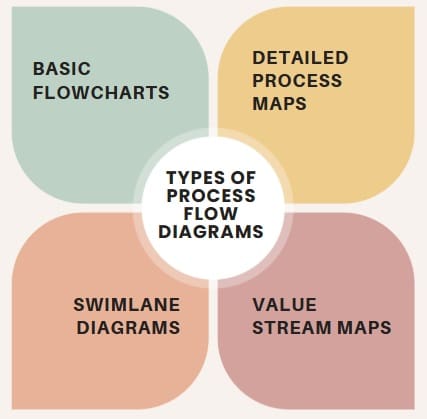
Basic Flowcharts
Basic flowcharts represent the simplest form of process flow diagrams, using standard symbols to show sequential steps and decision points. These diagrams work effectively for straightforward processes with minimal complexity and limited decision branches.
Organizations often use basic flowcharts for procedure documentation, training materials, and initial process analysis activities. The simplicity of these diagrams makes them accessible to all stakeholders regardless of their technical background or process improvement experience.
Detailed Process Maps
Detailed process maps provide comprehensive documentation of complex processes, including responsibilities, timing, resources, and quality checkpoints. These diagrams capture every aspect of process execution while maintaining visual clarity and usability.
Six Sigma teams frequently employ detailed process maps during improvement projects to understand current state processes before implementing changes. The comprehensive nature of these maps ensures that no critical elements are overlooked during analysis or redesign activities.
Value Stream Maps
Value stream maps focus specifically on identifying value-added and non-value-added activities within processes. These specialized diagrams help organizations eliminate waste while maximizing customer value delivery.
Lean manufacturing organizations rely heavily on value stream mapping to identify opportunities for cycle time reduction, inventory optimization, and flow improvement. The technique provides clear visibility into process efficiency and highlights areas requiring immediate attention.
Swimlane Diagrams
Swimlane diagrams organize process steps by responsibility, department, or function, creating clear accountability and interface identification. These diagrams prove particularly valuable for cross-functional processes involving multiple stakeholders.
The visual separation of responsibilities helps identify handoff points, communication requirements, and potential coordination issues. Moreover, swimlane diagrams facilitate role clarification and responsibility assignment during process implementation.
Essential Symbols and Standards in Process Flow Diagrams
Standard Flowchart Symbols
Process flow diagrams utilize universally recognized symbols to ensure consistent interpretation across organizations and industries. Oval shapes represent start and end points, rectangles indicate process steps, diamonds show decision points, and arrows demonstrate flow direction.
Standardized symbols eliminate confusion and enable effective communication between different teams, departments, and organizations. Furthermore, consistent symbol usage supports software compatibility and facilitates diagram sharing across platforms.
Industry-Specific Symbols
Certain industries employ specialized symbols that address unique process requirements and regulatory standards. Chemical processing, manufacturing, and software development sectors often use industry-specific symbols alongside standard flowchart elements.
These specialized symbols provide additional detail and precision required for technical processes while maintaining visual clarity. Teams should balance symbol specificity with diagram accessibility to ensure effective communication with all stakeholders.
Also Read: Workflow Diagram vs. Process Flow Diagram: Key Differences
Creating Effective Process Flow Diagrams Step by Step
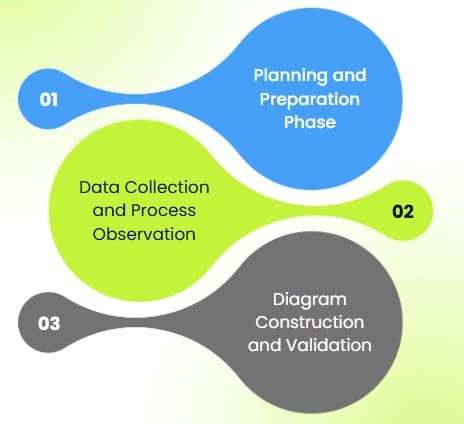
Planning and Preparation Phase
Successful process flow diagram creation begins with thorough planning and stakeholder engagement. Teams must clearly define the process scope, identify key participants, and establish diagram objectives before beginning visual documentation.
Process owners, subject matter experts, and end users should participate in planning activities to ensure comprehensive process understanding. Additionally, teams should gather existing documentation, procedures, and performance data to inform diagram development.
Data Collection and Process Observation
Direct process observation provides the most accurate information for flow diagram creation. Teams should observe actual process execution rather than relying solely on documented procedures, which may not reflect current practices.
Stakeholder interviews complement observation activities by capturing decision logic, exception handling, and process variations. This combination ensures that diagrams accurately represent real-world process execution rather than idealized versions.
Diagram Construction and Validation
Process flow diagram construction should progress systematically from high-level overview to detailed documentation. Teams typically start with major process steps before adding decision points, inputs, outputs, and supporting details.
Validation activities involve reviewing diagrams with process participants to confirm accuracy and completeness. This collaborative approach identifies missing elements, incorrect sequences, and opportunities for improvement before finalizing documentation.
Benefits of Implementing Process Flow Diagrams
Enhanced Process Understanding
Process flow diagrams provide clear visual representation that improves stakeholder understanding of complex operations. Visual documentation eliminates ambiguity and ensures consistent process interpretation across teams and departments.
The graphical format makes it easier to identify process relationships, dependencies, and critical paths that might be overlooked in text-based documentation. Consequently, teams can make more informed decisions about process improvements and resource allocation.
Improved Communication and Training
Visual process documentation significantly enhances communication effectiveness between stakeholders with different backgrounds and expertise levels. Process flow diagrams serve as common language that bridges technical and non-technical audiences.
Training programs benefit tremendously from visual process documentation, as new employees can quickly understand job requirements and process expectations. Furthermore, diagrams support knowledge transfer activities and reduce training time requirements.
Streamlined Process Analysis
Process flow diagrams enable systematic analysis of operations by providing clear visibility into process structure and performance characteristics. Teams can easily identify bottlenecks, redundancies, waste, and improvement opportunities through visual examination.
The structured format facilitates root cause analysis, process optimization, and problem-solving activities. Additionally, diagrams support quantitative analysis by enabling process measurement and performance tracking.
Regulatory Compliance and Documentation
Many industries require documented processes for regulatory compliance, quality certification, and audit purposes. Process flow diagrams provide standardized documentation that meets regulatory requirements while supporting operational excellence.
Compliance teams can easily verify process adherence and identify potential compliance gaps through visual process review. Moreover, diagrams facilitate audit preparation and regulatory reporting activities.
Also Read: 7 Steps to Create a Process Flow Diagram in Record Time!
Process Flow Diagram Applications Across Industries
Manufacturing Operations
Manufacturing organizations use process flow diagrams to document production processes, quality control procedures, and material handling operations. These diagrams support lean manufacturing initiatives by identifying waste and optimizing production flow.
Production planning teams rely on process flow diagrams to optimize equipment utilization, reduce setup times, and minimize work-in-process inventory. Additionally, diagrams support maintenance planning and equipment replacement decisions.
Healthcare Process Management
Healthcare organizations implement process flow diagrams to standardize patient care processes, reduce medical errors, and improve service delivery. These diagrams prove essential for compliance with healthcare regulations and accreditation requirements.
Clinical pathways, admission procedures, and treatment protocols benefit from visual documentation that ensures consistent care delivery. Furthermore, process flow diagrams support quality improvement initiatives and patient safety programs.
Software Development Workflows
Software development teams use process flow diagrams to document development methodologies, testing procedures, and deployment processes. These diagrams support agile development practices while ensuring quality and consistency.
DevOps teams particularly benefit from process flow diagrams that document continuous integration and deployment pipelines. Visual documentation helps identify automation opportunities and optimize development workflows.
Financial Services Operations
Financial institutions employ process flow diagrams to document transaction processing, compliance procedures, and customer service operations. These diagrams support regulatory compliance while optimizing operational efficiency.
Risk management processes, loan approval workflows, and audit procedures require detailed documentation that process flow diagrams provide effectively. Additionally, diagrams support process standardization across multiple locations and departments.
Digital Tools and Software for Process Flow Diagram Creation
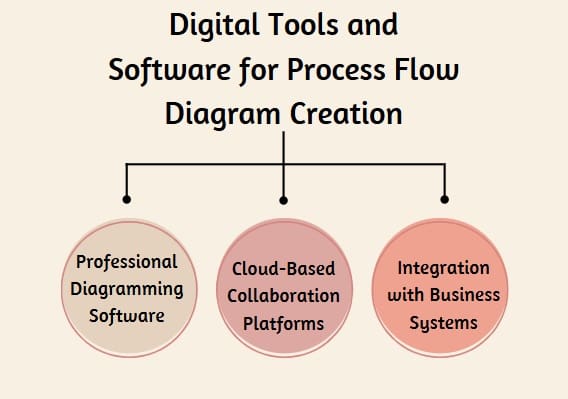
Professional Diagramming Software
Specialized diagramming software provides advanced features for creating professional process flow diagrams with standardized symbols and formatting options. These tools offer template libraries, collaboration features, and integration capabilities with other business systems.
Popular options include Microsoft Visio, Lucidchart, Draw.io, and SmartDraw, each offering unique strengths for different organizational needs. Teams should evaluate software based on functionality requirements, collaboration needs, and budget constraints.
Cloud-Based Collaboration Platforms
Cloud-based diagramming platforms enable real-time collaboration between distributed teams while maintaining version control and access security. These platforms support simultaneous editing, commenting, and approval workflows.
Integration with project management tools, document repositories, and communication platforms enhances productivity and ensures diagrams remain current with process changes. Furthermore, cloud platforms provide scalability and accessibility advantages over traditional desktop software.
Integration with Business Systems
Modern diagramming tools integrate with enterprise resource planning systems, business process management platforms, and data analytics tools. This integration enables automatic diagram updates and performance monitoring capabilities.
Data-driven process flow diagrams provide real-time visibility into process performance while supporting continuous improvement activities. Integration capabilities reduce manual maintenance requirements and ensure diagram accuracy over time.
Also Read: What is Flowchart?
Best Practices for Process Flow Diagram Design
Clarity and Simplicity Principles
Effective process flow diagrams balance comprehensive documentation with visual clarity to ensure stakeholder understanding. Teams should avoid unnecessary complexity while capturing essential process elements and decision points.
Consistent symbol usage, clear labeling, and logical flow direction enhance diagram readability and interpretation. Additionally, appropriate use of white space and visual hierarchy improves comprehension and reduces cognitive load.
Standardization and Consistency
Organizations benefit from establishing diagramming standards that ensure consistency across departments and projects. Standard templates, symbol libraries, and formatting guidelines support quality and efficiency in diagram creation.
Training programs should emphasize diagramming standards and best practices to build organizational capability. Furthermore, regular reviews and updates maintain standard relevance and effectiveness over time.
Continuous Improvement Integration
Process flow diagrams should support continuous improvement activities by enabling easy updates and version control. Teams must establish procedures for maintaining diagram currency as processes evolve and improve.
Performance metrics and improvement opportunities should be clearly indicated on process flow diagrams to support decision-making and prioritization activities. Additionally, diagrams should facilitate before-and-after comparisons to demonstrate improvement impacts.
Common Mistakes to Avoid in Process Flow Diagram Development
Excessive Complexity and Detail
While comprehensive documentation has value, overly complex diagrams can overwhelm stakeholders and reduce usability. Teams should create diagrams at appropriate levels of detail for their intended purpose and audience.
Hierarchical diagramming approaches enable multiple levels of detail without sacrificing clarity. High-level overview diagrams can link to detailed subprocess documentation when additional information is required.
Inadequate Stakeholder Involvement
Process flow diagrams created without sufficient stakeholder input often fail to accurately represent actual processes or meet user needs. Teams must engage process owners, operators, and customers throughout diagram development.
Regular review and feedback sessions ensure diagrams remain accurate and useful for their intended purposes. Additionally, stakeholder involvement builds ownership and commitment to process improvement initiatives.
Poor Maintenance and Updates
Outdated process flow diagrams can mislead stakeholders and hinder improvement efforts. Organizations must establish clear procedures for maintaining diagram currency as processes change and evolve.
Version control systems and change management procedures ensure that diagram updates are properly documented and communicated. Furthermore, regular review cycles identify diagrams requiring updates or retirement.
Measuring Process Flow Diagram Effectiveness
Usage and Adoption Metrics
Successful process flow diagrams demonstrate value through widespread adoption and regular usage by intended stakeholders. Organizations should track diagram access, downloads, and feedback to assess effectiveness.
Training completion rates and stakeholder satisfaction surveys provide additional insights into diagram utility and quality. High usage rates typically indicate that diagrams meet stakeholder needs and provide genuine value.
Process Improvement Results
Process flow diagrams should ultimately contribute to measurable process improvements such as reduced cycle times, lower error rates, and improved customer satisfaction. Organizations should track these outcomes to demonstrate diagram value.
Cost savings, productivity improvements, and quality enhancements resulting from process optimization provide compelling evidence of process flow diagram effectiveness. These metrics support continued investment in visual process documentation.
Future Trends in Process Flow Diagram Technology
Artificial Intelligence Integration
Artificial intelligence technologies are beginning to automate process discovery and diagram generation from existing data sources. These capabilities reduce manual effort while improving diagram accuracy and completeness.
Machine learning algorithms can identify process patterns, exceptions, and improvement opportunities from operational data. This automation potential will significantly enhance process analysis capabilities and speed improvement initiatives.
Interactive and Dynamic Diagrams
Future process flow diagrams will incorporate interactive elements and real-time data integration to provide dynamic process visibility. These capabilities will transform static documentation into living process dashboards.
Performance metrics, alerts, and drill-down capabilities will enhance decision-making and problem-solving effectiveness. Interactive diagrams will support operational management and continuous improvement activities more effectively than traditional static documentation.
Final Words
A Process Flow Diagram (PFD) is an essential tool for visualizing, analyzing, and improving business and engineering processes. By clearly outlining the sequence of steps, inputs, and outputs, PFDs help identify inefficiencies, streamline operations, and ensure better communication across teams.
Whether you’re working in manufacturing, chemical engineering, or service-based industries, using a well-structured process flow diagram enhances workflow transparency and supports data-driven decision-making. Embracing PFDs can lead to greater efficiency, reduced errors, and optimized performance across your operations
Frequently Asked Questions
Q: What is a process flow diagram and why is it important?
A process flow diagram is a visual representation that maps the sequence of steps, decisions, and activities within a process, helping organizations understand, analyze, and improve their operations while facilitating better communication and training.
Q: What symbols are commonly used in process flow diagrams?
Standard symbols include ovals for start/end points, rectangles for process steps, diamonds for decision points, circles for connectors, and arrows for flow direction, ensuring consistent interpretation across organizations.
Q: How detailed should a process flow diagram be?
The level of detail depends on the diagram’s purpose and audience, ranging from high-level overview diagrams for executives to detailed process maps for operators and improvement teams.
Q: What software tools are best for creating process flow diagrams?
Popular tools include Microsoft Visio, Lucidchart, Draw.io, SmartDraw, and cloud-based platforms that offer collaboration features, template libraries, and integration capabilities with business systems.
Q: How often should process flow diagrams be updated?
Process flow diagrams should be reviewed and updated whenever processes change, typically during regular review cycles, improvement projects, or when performance issues indicate process drift.
Q: What are the main benefits of using process flow diagrams?
Key benefits include improved process understanding, enhanced communication and training, streamlined analysis and problem-solving, regulatory compliance support, and identification of improvement opportunities.
Q: How can process flow diagrams support continuous improvement efforts?
Process flow diagrams enable systematic analysis of operations, identification of waste and bottlenecks, measurement of process performance, and documentation of improvement initiatives before and after implementation.


