
The arithmetic mean serves as one of the most fundamental concepts in mathematics and statistics, playing a crucial role in data analysis, research, and everyday decision-making. This essential measure of central tendency helps us understand datasets and make informed conclusions across various fields.
Table of contents
- What is Arithmetic Mean?
- Types of Arithmetic Mean
- Step-by-Step Calculation Process
- Arithmetic Mean vs. Other Measures of Central Tendency
- Advanced Arithmetic Mean Concepts
- Real-World Examples and Case Studies
- Future of Arithmetic Mean in Data Analysis
- Final Words
- Frequently Asked Questions on Arithmetic Mean
- Related Articles
What is Arithmetic Mean?
The arithmetic mean represents the sum of all values in a dataset divided by the total number of values. This simple yet powerful calculation provides a single number that represents the typical or central value of a group of numbers.
Mathematicians and statisticians use the arithmetic mean to summarize large amounts of data into one meaningful value. This measure helps identify patterns, trends, and characteristics within datasets that might otherwise remain hidden.
Furthermore, it forms the foundation for many advanced statistical concepts and serves as a building block for more complex mathematical operations. Understanding this concept enables students and professionals to tackle sophisticated analytical challenges.

Public, Onsite, Virtual, and Online Six Sigma Certification Training!
- We are accredited by the IASSC.
- Live Public Training at 52 Sites.
- Live Virtual Training.
- Onsite Training (at your organization).
- Interactive Online (self-paced) training,
Mathematical Formula for Arithmetic Mean
Basic Formula
The fundamental formula for calculating arithmetic mean involves adding all values and dividing by the count:
Arithmetic Mean = (Sum of all values) ÷ (Number of values)
In mathematical notation: x̄ = (x₁ + x₂ + x₃ + … + xₙ) ÷ n
Where x̄ represents the arithmetic mean, x₁, x₂, etc., are individual values, and n represents the total count of values.
Summation Notation
Mathematicians often express the arithmetic mean using summation notation:
x̄ = (∑xᵢ) ÷ n
This concise notation represents the same calculation while providing a more elegant mathematical expression. The sigma symbol (∑) indicates summation of all values from i=1 to n.
Types of Arithmetic Mean
Simple Arithmetic Mean
The simple arithmetic mean treats all values equally, giving each data point the same importance in the final calculation. This approach works best when all observations carry equal significance.
Students typically encounter simple arithmetic mean first because it requires straightforward addition and division operations. This fundamental version builds mathematical confidence and understanding.
Weighted Arithmetic Mean
The weighted arithmetic mean assigns different importance levels to various data points based on their significance or frequency. This approach provides more accurate results when some values deserve greater consideration.
Organizations frequently use weighted means when calculating grade point averages, stock market indices, or performance ratings where different components have varying importance levels.
Also Read: Mean, Median & Mode: Measures of Central Tendency
Step-by-Step Calculation Process
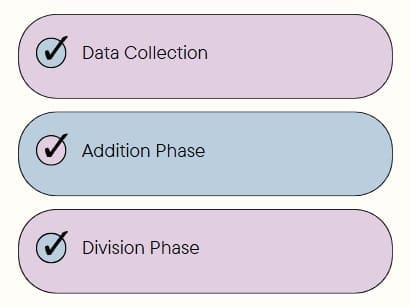
Data Collection
Begin by gathering all relevant numerical values that require analysis. Ensure data accuracy and completeness before proceeding with calculations, as errors at this stage affect final results.
Organize data systematically to prevent calculation mistakes and make the process more efficient. Clear data organization also helps identify potential outliers or unusual values.
Addition Phase
Add all values together to obtain the total sum. Use careful arithmetic to avoid computational errors, especially when working with large datasets or decimal numbers.
Consider using calculators or spreadsheet software for complex calculations to ensure accuracy. Double-check addition results before proceeding to the division step.
Division Phase
Divide the total sum by the number of values to obtain the arithmetic mean. Count data points carefully to ensure the denominator reflects the actual dataset size.
Round the final result appropriately based on the precision requirements of your specific application or analysis needs.
Practical Applications

Academic Performance Assessment
Educational institutions use arithmetic mean to calculate student grades, class averages, and academic performance indicators. Teachers rely on this measure to evaluate individual progress and class-wide understanding.
Moreover, standardized test scores often employ arithmetic mean calculations to establish benchmarks and compare performance across different groups or time periods.
Business and Finance
Companies calculate mean for various business metrics including sales performance, customer satisfaction ratings, and financial ratios. This analysis helps managers make informed decisions and identify trends.
Financial analysts use arithmetic mean to evaluate investment returns, calculate average stock prices, and assess portfolio performance over specific time periods.
Scientific Research
Researchers employ mean to summarize experimental data, compare treatment groups, and draw statistical conclusions. This measure helps scientists communicate findings clearly and effectively.
Laboratory studies frequently report arithmetic mean values alongside standard deviations to provide comprehensive data summaries for peer review and publication.
Quality Control
Manufacturing companies use it to monitor product quality, track defect rates, and maintain consistency standards. Quality control teams rely on these calculations to identify process improvements.
Additionally, service industries calculate average response times, customer wait periods, and satisfaction scores to enhance operational efficiency and customer experience.
Also Read: ‘Mean’ as a Measure of Central Tendency
Advantages of Using Arithmetic Mean
Simplicity and Clarity
The arithmetic mean offers straightforward calculation methods that most people can understand and apply. This accessibility makes it an ideal starting point for statistical education and practical applications.
Furthermore, the concept translates easily across different contexts and disciplines, making it a universal tool for data analysis and communication.
Mathematical Properties
Arithmetic mean possesses valuable mathematical properties that facilitate advanced statistical operations. These characteristics include linearity, which allows for algebraic manipulation and transformation.
The sum of deviations from the arithmetic mean always equals zero, providing a useful property for variance calculations and other statistical measures.
Comprehensive Data Utilization
Unlike other measures of central tendency, arithmetic mean incorporates every data point in the calculation. This comprehensive approach ensures that all available information contributes to the final result.
This characteristic makes arithmetic mean particularly valuable when researchers want to account for every observation in their dataset analysis.
Limitations and Considerations
Sensitivity to Outliers
Arithmetic mean shows high sensitivity to extreme values or outliers that can distort the final result. A single unusually high or low value can significantly shift the mean away from the typical range.
Researchers must identify and address outliers appropriately, either by removing them or using alternative measures of central tendency that resist their influence.
Skewed Distribution Effects
In datasets with skewed distributions, arithmetic mean may not accurately represent the typical value. The mean can be pulled toward the tail of the distribution, making it less representative.
Statistical analysts often supplement arithmetic mean with median and mode calculations to provide a more complete picture of data distribution characteristics.
Interpretation Challenges
While arithmetic mean provides a single summary value, it cannot convey information about data variability, distribution shape, or the presence of multiple peaks in the dataset.
Users must consider additional statistical measures to fully understand their data and avoid drawing incomplete or misleading conclusions from mean values alone.
Arithmetic Mean vs. Other Measures of Central Tendency
Arithmetic Mean vs. Median
The median represents the middle value when data is arranged in order, offering resistance to outlier effects that can distort arithmetic mean calculations. Each measure serves different analytical purposes.
Use arithmetic mean when data follows normal distribution patterns and all values deserve equal consideration. Choose median when dealing with skewed data or when outliers might mislead the analysis.
Arithmetic Mean vs. Mode
The mode identifies the most frequently occurring value in a dataset, providing insights into common or typical occurrences that arithmetic mean cannot reveal.
Combine arithmetic mean with mode analysis to understand both the central tendency and the most common values within your dataset for comprehensive analysis.
Also Read: Central Tendency
When to Use Each Measure?
Select arithmetic mean for normally distributed data where all observations carry equal weight and comprehensive data utilization is important. This choice works well for scientific measurements and financial calculations.
Choose alternative measures when dealing with ordinal data, extreme outliers, or when the research question focuses on typical rather than average values.
Advanced Arithmetic Mean Concepts
Population vs. Sample Mean
Population mean (μ) represents the arithmetic mean of an entire population, while sample mean (x̄) calculates the average of a subset drawn from that population.
Statistical inference uses sample means to estimate population parameters, making this distinction crucial for proper interpretation and application of results.
Sampling Distribution of the Mean
The sampling distribution describes how sample means vary across different samples drawn from the same population. This concept forms the foundation for confidence intervals and hypothesis testing.
Understanding sampling distribution helps researchers assess the reliability and precision of their mean calculations and statistical conclusions.
Central Limit Theorem
The Central Limit Theorem states that sample means approach normal distribution as sample size increases, regardless of the original population distribution shape.
This powerful theorem enables statistical inference even when population distributions are unknown, making arithmetic mean calculations more robust and widely applicable.
Computing Arithmetic Mean with Technology
Spreadsheet Applications
Modern spreadsheet software like Excel and Google Sheets provide built-in functions for calculating arithmetic mean. The AVERAGE function simplifies calculations and reduces computational errors.
These tools also enable dynamic calculations that automatically update when data changes, making them ideal for ongoing analysis and reporting requirements.
Statistical Software
Professional statistical packages like R, SPSS, and SAS offer sophisticated mean calculation capabilities along with comprehensive analytical tools for advanced statistical analysis.
These platforms provide additional features like weighted means, confidence intervals, and hypothesis testing that extend basic arithmetic mean functionality.
Programming Languages
Programming languages such as Python and R offer libraries and functions for calculating arithmetic mean as part of larger data analysis workflows and automated reporting systems.
Programmers can integrate mean calculations into complex algorithms and machine learning models that require statistical preprocessing and feature engineering.
Best Practices for Arithmetic Mean Calculations
Data Quality Assurance
Always verify data accuracy and completeness before calculating arithmetic mean. Clean datasets produce more reliable results and support better decision-making processes.
Implement systematic data validation procedures to identify and address missing values, data entry errors, and inconsistent formatting that could affect calculations.
Contextual Interpretation
Consider the context and purpose of your analysis when interpreting arithmetic mean results. The same numerical value can have different meanings depending on the situation and application.
Provide appropriate context and background information when reporting arithmetic mean values to ensure accurate understanding and proper application of results.
Supplementary Analysis
Complement arithmetic mean calculations with measures of variability like standard deviation and range to provide comprehensive data summaries and deeper insights.
Include additional descriptive statistics and visualizations to help stakeholders understand the complete data story beyond simple average calculations.
Common Mistakes and How to Avoid Them?
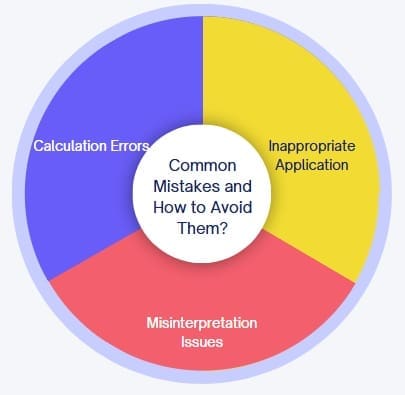
Calculation Errors
Double-check arithmetic operations, especially when working with large datasets or complex decimal numbers. Use technology tools when possible to minimize computational mistakes.
Verify that the count of values matches the actual dataset size to ensure accurate division operations and correct arithmetic mean results.
Inappropriate Application
Avoid using arithmetic mean with categorical or ordinal data where numerical averaging doesn’t make logical sense. Select appropriate measures of central tendency based on data type and characteristics.
Recognize when outliers or skewed distributions make arithmetic mean less representative than alternative measures like median or mode.
Misinterpretation Issues
Remember that arithmetic mean represents an average that may not correspond to any actual data point in the dataset. Avoid assuming the mean represents a typical or real observation.
Consider the practical meaning and limitations of arithmetic mean results when making decisions or drawing conclusions from statistical analysis.
Real-World Examples and Case Studies
Educational Assessment
A teacher calculates the arithmetic mean of test scores to evaluate class performance: (85 + 92 + 78 + 88 + 95) ÷ 5 = 87.6. This average helps assess overall class understanding and identify areas for improvement.
Business Performance
A sales manager determines average monthly revenue: ($45,000 + $52,000 + $38,000 + $47,000) ÷ 4 = $45,500. This calculation helps set realistic targets and evaluate performance trends.
Scientific Research
Researchers measure plant growth under different conditions and calculate mean height: (12.3 + 11.8 + 13.1 + 12.7 + 12.4) cm ÷ 5 = 12.46 cm. This average enables comparison between experimental groups.
Future of Arithmetic Mean in Data Analysis
Big Data Applications
As datasets grow larger and more complex, arithmetic mean calculations become integral to big data analytics and machine learning algorithms that process massive amounts of information.
Cloud computing platforms enable rapid arithmetic mean calculations across distributed datasets, making this fundamental concept more powerful and widely applicable.
Automated Analysis
Artificial intelligence and machine learning systems increasingly rely on arithmetic mean calculations for feature engineering, data preprocessing, and algorithm optimization in automated decision-making processes.
Final Words
The arithmetic mean stands as a fundamental pillar of mathematics and statistics, providing essential tools for data analysis and decision-making across countless applications. Its simplicity, mathematical properties, and universal applicability make it an indispensable concept for students, professionals, and researchers.
Understanding arithmetic mean enables individuals to summarize complex datasets, identify trends, and communicate findings effectively. However, successful application requires awareness of its limitations and appropriate use of supplementary statistical measures.
Mastering arithmetic mean calculations and interpretation skills opens doors to advanced statistical concepts and data analysis techniques. This foundational knowledge serves as a stepping stone to more sophisticated mathematical and analytical capabilities.
Frequently Asked Questions on Arithmetic Mean
What is arithmetic mean?
Arithmetic mean is the sum of all values in a dataset divided by the total number of values. It represents the average or central value of a group of numbers and is calculated using the formula: Arithmetic Mean = (Sum of all values) ÷ (Number of values).
How do you calculate arithmetic mean?
To calculate arithmetic mean: 1) Add all values in the dataset together to get the total sum, 2) Count the total number of values in the dataset, 3) Divide the sum by the count of values. For example, for values 10, 15, 20: (10+15+20) ÷ 3 = 15.
What is the difference between arithmetic mean and median?
Arithmetic mean is the sum of all values divided by the count, while median is the middle value when data is arranged in order. Arithmetic mean uses all data points and is sensitive to outliers, whereas median is resistant to extreme values and better represents typical values in skewed distributions.
When should you use arithmetic mean?
Use arithmetic mean when data is normally distributed, all values have equal importance, and you want to utilize all data points in the calculation. It’s ideal for continuous numerical data, scientific measurements, and situations where comprehensive data utilization is important.
What is weighted arithmetic mean?
Weighted arithmetic mean assigns different importance levels to various data points based on their significance, while simple arithmetic mean treats all values equally. Weighted mean is calculated by multiplying each value by its weight, summing these products, and dividing by the sum of weights.
How do outliers affect arithmetic mean?
Outliers significantly affect arithmetic mean by pulling the average toward extreme values, making it less representative of typical data. A single unusually high or low value can shift the mean substantially, which is why analysts often identify and address outliers before calculation.