
A flowchart is a diagrammatic representation of a process or a system. It outlines the steps required to solve a problem or complete a task, using standardized symbols to depict different types of operations. By mapping out these steps, flowcharts allow programmers to visualize the program’s logic before translating it into code.
This pre-coding visualization helps in identifying potential errors and refining the logic to ensure a smoother coding phase.
Table of contents
What is a Flowchart?
A flowchart represents a sequence of steps in a process or system through a diagram. Each step uses a specific symbol, and arrows indicate the flow between these steps.
This visual representation helps in understanding the process flow and identifying potential areas for improvement.
It is also known as flow diagrams, and they serve various purposes:
- Process Mapping: To visualize and analyze the steps involved in a process.
- Documentation: To document and standardize processes for training and reference.
- Problem-Solving: To identify inefficiencies, redundancies, or issues within a process.
When to Use Flowcharts?
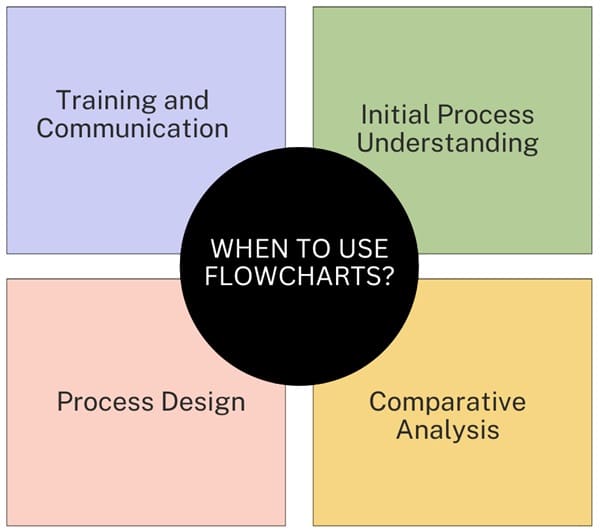
Flowcharts are particularly useful in the following scenarios:
- Initial Process Understanding: When starting a process improvement initiative, creating an ‘as-is’ flowchart helps understand the current state of the process.
- Comparative Analysis: Comparing the ‘as-is’ flowchart with the ‘to-be’ or ideal flowchart helps identify gaps and areas for enhancement.
- Process Design: Developing a flowchart for the modified or ideal process helps visualize the proposed changes and their impact.
- Training and Communication: It is an effective tool for training employees and communicating process details to stakeholders.
Advantages
- Improved Communication: They make it easier to explain complex processes and systems to others.
- Effective Analysis: They help in breaking down and analyzing processes to identify inefficiencies.
- Documentation: Serves as a valuable documentation tool for processes, which can be used for training and reference.
- Enhanced Debugging: Simplify the identification of issues and help in troubleshooting problems.
- Streamlined Maintenance: Facilitate easier updates and maintenance by providing a clear view of the process.
- Visual Representation: They provide a clear, visual outline of program logic, making it easier to understand and communicate the program’s structure.
- Error Detection: It helps identify logical errors and inconsistencies in the design phase before coding begins.
- Modular Design: Programmers can develop and test individual modules separately before integrating them into the full system.
- Efficient Debugging: It facilitates systematic debugging by allowing programmers to trace the logic visually.
- Improved Coding: With a well-prepared flowchart, translating logic into code becomes more straightforward and less prone to errors.
Limitations
- Complexity: Complex processes can result in complicated and cluttered flowcharts, making them difficult to read and understand.
- Revisions: Changes to the process may require significant updates to the flowchart, which can be time-consuming.
- Symbol Limitations: Standard symbols may not always capture all aspects of a process, requiring additional explanations or custom symbols.
Types
Flowcharts can be categorized on various bases:
Based on Purpose
1. Program Flowcharts
Program flowcharts are essential tools for programmers. They detail the logic, structure, and sequence of operations within a program. These flowcharts are integral to the documentation process and include:
- Program Structure: Outlines the overall architecture of the program.
- Program Logic: Shows the sequence of operations and decisions.
- Data Inputs: Depicts how data is received at various stages.
- Data Processing: Illustrates how data is manipulated.
- Computations: Shows mathematical operations involved.
- Decision Points: Indicates where decisions are made.
- Branching and Looping: Displays decision-based branches and loops.
- Results: Shows the output or end results.
- Various Outputs: Illustrates different outcomes produced by the program.
The primary focus of a program flowchart is to lay out the logic clearly and systematically.
2. System Flowcharts
System analysts use system flowcharts to map out the processes, subsystems, and operations of a larger system. They help in understanding how different parts of a system interact and process data. Although this guide primarily focuses on program flowcharts, understanding system flowcharts is valuable for comprehending the broader context in which a program operates.
Based on Focus
- Linear Flowchart: Shows a straightforward sequence of steps. This type is useful for processes with a clear, unbranched flow.
- Deployment Flowchart: Illustrates the process flow along with the roles or departments involved at each step. It helps in understanding customer-supplier relationships and interactions between different groups.
- Opportunity Flowchart: Focuses on identifying potential improvements and opportunities within the process. It highlights areas where changes could lead to enhanced efficiency or effectiveness.
Flowchart Symbols and Their Meanings
It uses a variety of standardized symbols to represent different types of operations and decisions. The American National Standards Institute (ANSI) has established these symbols to ensure consistency and clarity across different flowcharts.
1. Terminal Symbol
- Purpose: Marks the start and end of a flowchart.
- Symbol: Oval shape.
- Use: The “START” symbol indicates the beginning of the flowchart, while the “STOP” symbol denotes the end. A flowchart must include only one “START” and one “STOP,” although you can use additional terminal symbols for pauses or special conditions.
2. Input/Output Symbol
- Purpose: Represents input and output operations.
- Symbol: Parallelogram shape.
- Use: Indicates operations involving data input (e.g., from a keyboard or file) and output (e.g., to a printer or screen).
3. Process Symbol
- Purpose: Represents data processing and arithmetic operations.
- Symbol: Rectangle shape.
- Use: Used for calculations, data manipulation, and processing instructions. You can include multiple sequential processes within a single process symbol.
4. Decision Symbol
- Purpose: Represents decision-making points.
- Symbol: Diamond shape.
- Use: Shows where the flow of control branches based on a condition. Account for all possible outcomes of the decision, leading to different paths based on the result.
5. Flowlines
- Purpose: Indicate the direction of the flow.
- Symbol: Arrowed lines.
- Usage: Solid lines with arrowheads show the sequence of steps and the flow of control from one step to the next. The flow generally moves from top to bottom and left to right.
6. Connectors
- Purpose: Manage flow in complex or multi-page flowcharts.
- Symbol: Small circles with letters or numbers.
- Use: Connectors link different parts of a flowchart, especially when it spans multiple pages. They help maintain clarity and avoid crossing lines.
Levels of Flowchart Detail
The level of detail in a flowchart varies based on its purpose:
- Macro Level: Provides an overview of the entire process with a few high-level steps. It is akin to viewing the process from a high altitude, offering a broad perspective.
- Mini Level: Offers more detail than the macro level but still focuses on specific parts of the process. It is like observing the process from a mid-level perspective.
- Micro Level: Delivers an in-depth view of the process, documenting each step and decision in detail. This level is useful for analyzing and improving specific tasks.
Creating a Flowchart
To create an effective flowchart, follow these steps:
- Identify the Process: Determine the process or system to be charted and its boundaries (start and end points).
- Gather Information: Collect details on each step, decision point, and the flow of the process from relevant stakeholders.
- Choose Symbols: Select appropriate symbols to represent different types of actions, decisions, and connections.
- Record Steps: Document the steps in the process on index cards or sticky notes for flexibility in arrangement.
- Arrange Steps: Organize the steps in the correct sequence based on the observed process.
- Draw the Flowchart: Use drawing tools or software to create the flowchart, ensuring clarity and accuracy.
Developing Flowcharts
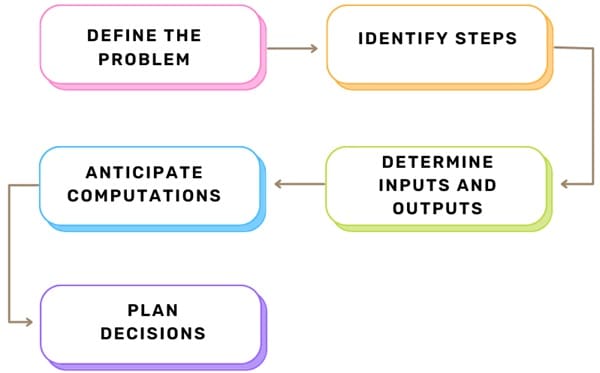
When creating it, follow these steps:
- Define the Problem: Clearly state the problem or task to be solved.
- Identify Steps: Break down the solution into sequential steps.
- Determine Inputs and Outputs: Specify what data will be needed and what the expected results will be.
- Anticipate Computations: Identify any calculations or data manipulations required.
- Plan Decisions: Define the decision points and the possible outcomes.
Advanced Flowcharting Techniques
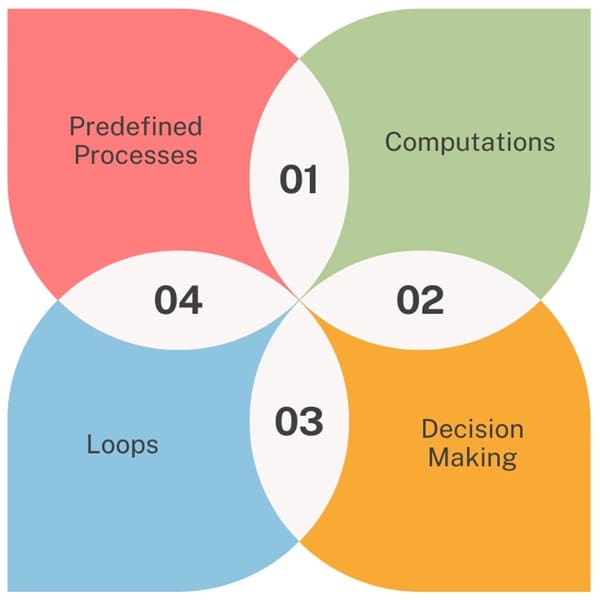
- Computations: Flowcharts for calculations involve initializing variables, performing arithmetic operations, and displaying results. For instance, converting Celsius to Fahrenheit involves reading a temperature in Celsius, computing its Fahrenheit equivalent, and then displaying the result.
- Decision Making: Flowcharts for decision-making use conditional statements to branch the flow based on specific criteria. For example, checking if a student passes based on their marks involves branching paths for each decision point.
- Loops: Flowcharts for loops show repeated execution of steps until a condition is met. Fixed loops run a set number of times, while variable loops continue until a condition is fulfilled. For example, summing the first N numbers involves initializing a counter, incrementing it, and repeating until the desired count is reached.
- Predefined Processes: In large systems, flowcharts may include predefined processes, which act as black boxes with known inputs and outputs but hidden internal workings. These can simplify complex flowcharts and save development time.
Practical Applications
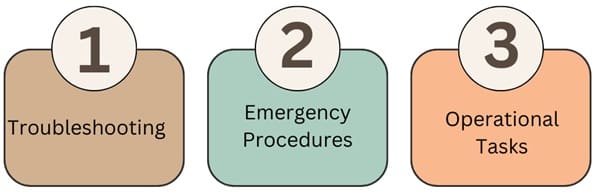
It is used in various practical scenarios:
- Troubleshooting: For example, troubleshooting a malfunctioning turbine involves a flowchart to guide the steps for diagnosing and fixing the issue.
- Emergency Procedures: Flowcharts can outline procedures for handling specific emergencies, such as a class BRAVO fire.
- Operational Tasks: Processes like cleaning a berthing compartment or getting a ship underway can be effectively represented and managed using flowcharts.
Final Words
Flowcharting is a powerful tool for visualizing and managing processes. By using standardized symbols and a structured approach, flowcharts help in understanding, documenting, and improving processes. Whether used for process improvement, training, or documentation, flowcharts provide clarity and facilitate effective communication among team members and stakeholders.
Despite their limitations, the benefits of flowcharting in enhancing process efficiency and understanding make them an essential component in various fields and applications.


