
In Design of Experiments (DOE), a block is a group of experimental runs conducted under conditions that are as similar as possible, specifically to isolate and remove the effect of a known, uncontrollable source of variation from the experimental results. That source of variation is called a nuisance factor — a variable the experimenter knows affects the response but is not the subject of the experiment and cannot be held constant across all runs.
By grouping runs into blocks, a Six Sigma practitioner separates the nuisance factor’s contribution to variability from the treatment effects they actually care about, making the experiment more sensitive to real differences between factor levels.
Table of contents
- Meaning of a block in DOE
- What Is a Block in DOE?
- Block vs. Blocking Factor: Keeping the Terms Precise
- The Randomized Complete Block Design (RCBD)
- A Worked Manufacturing Example
- Blocking vs. Randomization: When to Use Each
- When Blocking Improves Experiment Precision — and When It Does Not
- Block in the Six Sigma DMAIC Framework
Meaning of a block in DOE
A block is a set of experimental runs performed under conditions that are as uniform as possible with respect to a known nuisance factor. Blocks are used when a nuisance factor — such as operator, shift, raw material batch, day, or machine — is known to affect the response variable but cannot be controlled or held constant across all experimental runs. Grouping runs into blocks removes the nuisance factor’s variation from the experimental error, increasing the precision of the experiment.
The most common blocking design in Six Sigma is the Randomized Complete Block Design (RCBD), where every treatment combination appears once within each block and treatments are randomly assigned within each block.
Key Takeaways
- A block is a group of homogeneous experimental runs in which a nuisance factor is held as constant as possible, so its effect can be separated from the treatment effects being studied.
- A nuisance factor is a variable known to affect the response that the experimenter cannot control or does not want to study — common examples include shift, operator, raw material lot, machine, and day of the week.
- The golden rule of experimental design is: block what you can, randomize what you cannot. Known nuisance factors are handled with blocking; unknown nuisance factors are neutralized by randomizing run order.
- The Randomized Complete Block Design (RCBD) is the most widely used blocking design. Each block contains all treatment combinations at least once, and treatments are randomly assigned within each block.
- Blocking removes nuisance factor variability from the experimental error term, which reduces the error mean square in the ANOVA table and increases the experiment’s ability to detect real treatment effects.
- In Six Sigma, blocking most commonly appears in the Improve phase of DMAIC during designed experiments aimed at identifying optimal process settings or validating that a process change produced a real improvement.
- The key limitation of blocking: blocking factors must not interact with the treatment factors. If a nuisance factor interacts with the factors being studied, blocking can confound results rather than clarify them.

Public, Onsite, Virtual, and Online Six Sigma Certification Training!
- We are accredited by the IASSC.
- Live Public Training at 52 Sites.
- Live Virtual Training.
- Onsite Training (at your organization).
- Interactive Online (self-paced) training,
What Is a Block in DOE?
In everyday language, a “block” is a chunk or group. In Design of Experiments, the meaning is precise: a block is a subset of experimental runs performed under conditions that are internally as uniform as possible with respect to one or more known sources of variation that the experimenter cannot eliminate.
The purpose of a block is not to study the nuisance factor. It is to account for it so its variation does not contaminate the conclusions about the factors that do matter.
A Simple Illustration
Suppose a Six Sigma team is running an experiment to test three different machine settings — call them low, medium, and high — on a production process. They need to collect data across three production shifts because the plant runs continuously. They know shift-to-shift differences in temperature, operator technique, and ambient conditions affect the output, but shift is not what they are studying.
Without blocking, run order might mix settings randomly across shifts. The observed differences between settings could then reflect either true setting effects or shift effects or both, and the team cannot tell which.
With blocking, the team assigns one block to each shift. Within each shift (each block), all three settings are tested in random order. Now the shift effect — whatever systematic difference exists between shifts — applies equally to all three settings within each block. The ANOVA analysis can isolate and remove the block (shift) effect, leaving a cleaner estimate of the true differences between settings.
Also Read: Lean Accounting – How Does it Work?
Block vs. Blocking Factor: Keeping the Terms Precise
Two closely related terms often appear together in DOE discussions, and a precise distinction between them is useful for IASSC exam accuracy.
| Term | Definition |
| Block | A specific group of experimental runs that are conducted under homogeneous conditions for the nuisance factor. One shift, one batch of material, one machine. |
| Blocking factor | The variable used to define the blocks — the nuisance variable itself. Shift, material batch, machine number. |
| Block effect | The difference in the response caused by being in a particular block, rather than by the treatment factors. The ANOVA separates this out. |
The blocking factor is the cause; the blocks are the groups it creates. In the shift example, “shift” is the blocking factor. “Day shift,” “afternoon shift,” and “night shift” are the three blocks.
The Randomized Complete Block Design (RCBD)
The Randomized Complete Block Design (RCBD) is the most commonly used blocking structure in Six Sigma DOE work. It is the design most practitioners mean when they say they “used blocking” in an experiment.
How RCBD Works
In an RCBD:
- The experimenter identifies the nuisance factor and uses it to define blocks of homogeneous experimental units.
- Each block is large enough to accommodate all treatment combinations at least once.
- Within each block, the treatment combinations are randomly assigned to the available experimental units.
The word “complete” in RCBD means every treatment appears in every block. The word “randomized” means the order in which treatments are run within each block is determined randomly.
Why Randomization Within Blocks Still Matters
Even within a block — within a single shift, for example — the order of the experimental runs should still be randomized. Other uncontrolled, unknown factors could cause a trend over time within the shift (such as gradual temperature drift or operator fatigue). Randomizing within the block neutralizes these unknown intra-block effects, even though the block itself has already neutralized the known between-block effect (the shift difference).
This reinforces the golden rule: block what you can (the known shift effect), randomize what you cannot (unknown within-shift effects).
Also Read: What Is a Triage Workflow, and How Does It Work?
A Worked Manufacturing Example
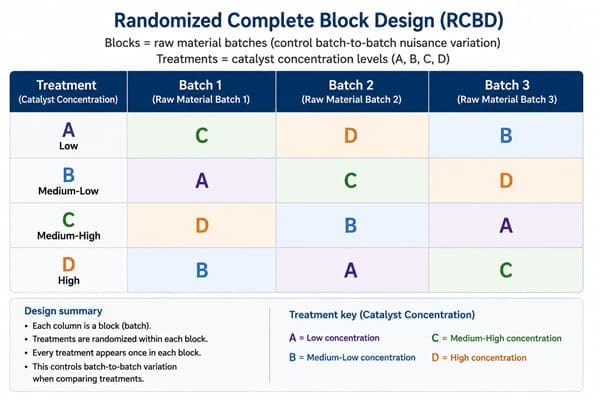
Scenario: A Black Belt team is testing four catalyst concentrations (A, B, C, D) to determine which produces the highest chemical yield. The experiment requires 12 total runs (three replicates of each treatment). The team must run the experiment across three different raw material batches, and they know batch-to-batch variation significantly affects yield even under identical process conditions.
Blocking structure:
- Batch 1 = Block 1: treatments A, B, C, D run in random order using Batch 1 material
- Batch 2 = Block 2: treatments A, B, C, D run in random order using Batch 2 material
- Batch 3 = Block 3: treatments A, B, C, D run in random order using Batch 3 material
What this achieves:
Within each block, all four catalyst concentrations are tested on the same raw material batch. Any differences in yield within a block are attributable to the catalyst concentration, not to batch-to-batch material variation. The ANOVA analysis estimates and removes the block (batch) effect, then tests whether catalyst concentration produces a significant difference in yield after accounting for batch variation.
If blocking were not used and the 12 runs were assigned completely at random across batches, some catalyst treatments might end up assigned to the better-performing batch more often than others purely by chance. The observed treatment differences would then be confounded with batch differences, and the team could not confidently conclude which catalyst concentration actually produces the highest yield.
Blocking vs. Randomization: When to Use Each
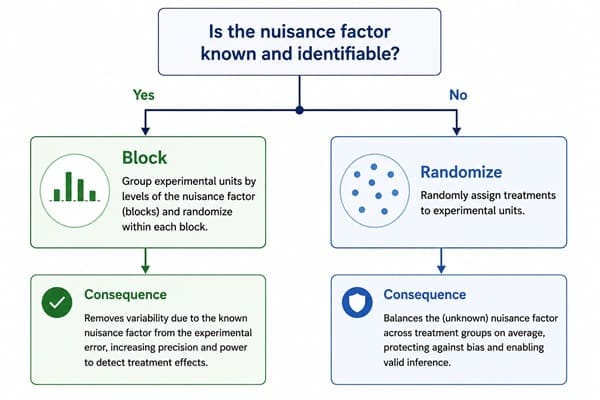
The decision between blocking and randomizing a nuisance factor is one of the most important judgment calls in DOE design.
| Condition | Approach | Reason |
| Nuisance factor is known and controllable (can be held constant) | Hold constant | Eliminates variability entirely for those runs |
| Nuisance factor is known but cannot be held constant (shift, batch, day) | Block | Removes its effect from the error term through the block structure |
| Nuisance factor is unknown or unidentified | Randomize | Distributes its unknown effect randomly across all treatment combinations, preventing systematic bias |
The practical guidance distilled from decades of DOE literature is the rule of thumb that George Box, a foundational statistician in experimental design, and others popularized: block what you can, and randomize what you cannot.
Blocking requires that the practitioner actually knows the nuisance factor exists and can measure or identify it. Randomization is the failsafe for everything else.
When Blocking Improves Experiment Precision — and When It Does Not
Blocking is not always beneficial. Understanding when it helps and when it creates problems is the nuance that distinguishes a practitioner who uses blocking correctly from one who applies it by habit.
When Blocking Helps
Blocking significantly improves the precision of an experiment when the nuisance factor accounts for a substantial portion of the total variability in the response. If shift-to-shift differences produce large swings in the output, then blocking by shift removes a large source of noise from the error term, making real treatment effects much easier to detect. The experiment becomes more efficient — requiring fewer runs to achieve the same statistical power as an unblocked design would require.
When Blocking Has Little Effect
If the nuisance factor actually has a small or negligible effect on the response, blocking by it removes very little variability from the error term while consuming degrees of freedom in the ANOVA. In a small experiment, losing degrees of freedom to a useless blocking factor can actually reduce statistical power rather than increase it.
This is why practitioners should have a substantive, data-supported reason for choosing a blocking factor — not simply include every possible nuisance variable in the block structure out of caution.
When Blocking Can Harm Results
If the blocking factor interacts with the treatment factors — meaning the effect of a treatment differs depending on which block it appears in — the RCBD structure is no longer appropriate. A standard RCBD analysis assumes no block-by-treatment interaction. If that interaction exists, blocking can confound the treatment effects rather than clarify them. In that case, a more complex design (such as a split-plot design) is needed that explicitly models the interaction.
Block in the Six Sigma DMAIC Framework
Blocking in DOE is a concept that belongs primarily to the Improve phase of DMAIC, where designed experiments are used to identify optimal process settings or validate that a proposed improvement actually works.
| DMAIC Phase | Role of Blocking |
| Define | Not applicable |
| Measure | Baseline data collection may informally stratify by shift or batch, which is related to but distinct from formal blocking in DOE |
| Analyze | Screening experiments during the Analyze phase may use blocking when runs must span multiple shifts or batches |
| Improve | The primary home of formal DOE blocking. Blocking controls nuisance factors when a full factorial or fractional factorial experiment must be run across multiple shifts, operators, material lots, or machines |
| Control | Not typically applicable; the control phase monitors the process under the new settings identified by the DOE |
According to the Quality America Six Sigma Demystified reference by Paul Keller, blocking is necessary specifically when all experimental runs cannot be completed under the same environmental conditions, and the maximum block size is often limited by practical constraints such as the number of runs that can be completed in a single shift or day.
Block in Minitab
When running a blocked experiment in Minitab, blocking is incorporated directly into the experimental design setup.
In Minitab’s Stat > DOE > Factorial > Create Factorial Design workflow, after specifying the number of factors and runs, the practitioner enters the number of blocks. Minitab automatically generates the randomized block structure, assigning treatment combinations to blocks and randomizing within each block. The resulting design matrix includes a “Block” column identifying which block each run belongs to.
When analyzing the results (Stat > DOE > Factorial > Analyze Factorial Design), Minitab includes the block effect in the ANOVA table as a separate source of variation. This allows the practitioner to see exactly how much variability the blocking factor accounted for and confirm that blocking improved the experiment’s resolution.
If the block effect is large and statistically significant, it confirms that the decision to block was correct — the nuisance factor was a real source of variability that, without blocking, would have inflated the experimental error. If the block effect is small and non-significant, the blocking factor had little impact, though this does not mean blocking was wrong; it simply means the nuisance factor was not as influential as expected.
Frequently Asked Questions: Block in DOE
Q: What is a block in Design of Experiments?
A: A block is a group of experimental runs conducted under conditions that are as similar as possible with respect to a known nuisance factor — a variable that affects the response but is not the subject of the experiment. Blocking groups runs so the nuisance factor’s effect can be separated from the treatment effects in the ANOVA, reducing experimental error and increasing the precision of the conclusions.
Q: What is a nuisance factor and how does it relate to blocking?
A: A nuisance factor is a variable the experimenter knows affects the response variable but cannot control or does not want to study. Common examples in manufacturing include production shift, operator, raw material batch, machine, and ambient temperature. Blocking is the technique used to handle a known nuisance factor by grouping experimental runs so the nuisance factor’s effect can be estimated and removed from the experimental error.
Q: What is the difference between blocking and randomization in DOE?
A: Blocking handles known, identifiable nuisance factors by grouping runs so their effect can be removed from the error term. Randomization handles unknown or unidentifiable nuisance factors by distributing their effects randomly across all treatment combinations, preventing systematic bias. The established rule is to block what you can and randomize what you cannot.
Q: What is a Randomized Complete Block Design (RCBD)?
A: The RCBD is the most commonly used blocking design. In an RCBD, each block contains all treatment combinations at least once, and the treatments are randomly assigned within each block. “Complete” means every treatment appears in every block; “randomized” means run order within each block is random. The RCBD is appropriate when one nuisance factor must be controlled and each block is large enough to accommodate all treatments.
Q: When should blocking NOT be used?
A: Blocking should not be used when the nuisance factor is suspected to interact with the treatment factors being studied, because a standard RCBD assumes no such interaction exists. If an interaction between the block and treatment is present, more complex designs such as a split-plot design are needed. Blocking with a nuisance factor that turns out to have a negligible effect on the response also wastes degrees of freedom, slightly reducing statistical power in small experiments.
Q: How does blocking appear in Minitab?
A: In Minitab, blocking is specified during experiment creation under Stat > DOE > Factorial > Create Factorial Design by entering the desired number of blocks. Minitab generates the block structure automatically and includes a “Block” column in the design matrix. In the ANOVA output from Analyze Factorial Design, the block effect appears as a separate row, allowing the practitioner to quantify how much variability the blocking factor accounted for.
Q: How does blocking differ from a block diagram?
A: In Six Sigma DOE, a block is a group of homogeneous experimental runs used to control a nuisance factor. A block diagram is an entirely different tool — a high-level flowchart used in engineering and software design to show how system components connect. The two concepts share only the word “block.” In a Six Sigma glossary, “block” refers to the DOE technique.
Block Training in Six Sigma
Blocking in DOE is a Green Belt and Black Belt topic. The IASSC Body of Knowledge includes experimental design concepts — including blocking, randomization, and the RCBD — as testable content in the Improve phase curriculum. Practitioners who understand blocking correctly design better experiments, draw more reliable conclusions, and avoid the confounding errors that occur when nuisance factors are ignored.
At Six Sigma Development Solutions Inc, DOE concepts including blocking, randomization, and the RCBD are taught as applied skills in our Green Belt and Black Belt training programs, with real manufacturing and service industry scenarios used to illustrate when and how to apply each design.
We offer Six Sigma training in three formats:
- Onsite training — Delivered at your facility, using your actual process variables and known nuisance factors as the context for DOE blocking exercises.
- Live virtual training — Instructor-led sessions delivered online, including guided Minitab DOE design exercises covering block structure and ANOVA interpretation.
- Online training — Self-paced Green Belt and Black Belt certification programs covering all IASSC-testable DOE content, including blocking and randomization.
Explore our Six Sigma training programs or contact our team to find the right program for your goals.
About Six Sigma Development Solutions, Inc.
Six Sigma Development Solutions, Inc. offers onsite, public, and virtual Lean Six Sigma certification training. We are an Accredited Training Organization by the IASSC (International Association of Six Sigma Certification). We offer Lean Six Sigma Green Belt, Black Belt, and Yellow Belt, as well as LEAN certifications.
Book a Call and Let us know how we can help meet your training needs.


