
Have you ever faced a large amount of information—maybe customer feedback, project ideas, or complex data—that seems messy and hard to handle? You know the answers are in there, but how do you find the key themes and common points? Affinity mapping offers you a clear way to organize all that chaos.
We will explore this powerful technique, understand what it does, and see exactly how you can use it to turn a jumble of data into structured, actionable insights. By using an affinity diagram, you will gain a clear path to make sense of even the most complex challenges.
Table of contents
What is an Affinity Diagram?
An affinity diagram can be understood as an organizational tool that helps you take a great number of ideas, facts, or opinions and group them based on their natural relationship or “affinity.” This process is affinity mapping, and the final grouped structure is the affinity chart or affinity map.
The purpose of an affinity diagram is to help teams think through complex problems and identify patterns from a pool of unstructured data. You use this technique when you generate many ideas—perhaps in a brainstorming session—and you need to organize them.
- Affinity diagramming involves placing individual ideas onto separate notes.
- The team then groups these notes silently by looking for themes or similarities.
- Finally, the team assigns a header or title to each group that accurately describes the central theme of all the ideas within.
What is affinity mapping at its core? Simply put, it is a method for organizing creative chaos.

Public, Onsite, Virtual, and Online Six Sigma Certification Training!
- We are accredited by the IASSC.
- Live Public Training at 52 Sites.
- Live Virtual Training.
- Onsite Training (at your organization).
- Interactive Online (self-paced) training,
Why should you use Affinity Grouping?
When you work with a team, you often generate a high volume of input. Affinity grouping plays a vital role in processing this input efficiently.
- It helps in achieving team consensus by making the grouping process objective. The ideas themselves drive the grouping, not team hierarchy.
- It provides structure to seemingly unrelated data. You transform diverse inputs into clear categories.
- It enables you to focus on the bigger picture. By creating high-level headers, you step away from individual details and focus on major themes.
This technique is essential for projects where understanding user needs or breaking down a complex issue is the first step.
Also Read: Causal Loop Diagram (CLD)
Affinity Diagram vs. Mind Mapping
While both techniques organize information visually, they serve different purposes.
| Basis for Comparison | Affinity Diagram | Mind Mapping |
| Primary Goal | To organize a large number of unstructured data points (post-it notes, ideas) into logical groups based on similarity. | To visually represent and organize thoughts or ideas around a central concept to aid memory and creativity. |
| Starting Point | Many separate, distinct pieces of data or ideas generated by a group. | A single, central topic or concept. |
| Structure | A collection of distinct groups or clusters, each with a header. | A radial, hierarchical structure branching out from the center. |
| Process | Affinity grouping—moving separate notes until they naturally cluster. | Association and elaboration—adding related concepts as branches. |
| Typical Use | Processing brainstorming results, UX research data, and problem analysis. | Note-taking, studying, personal idea generation, and creative problem-solving. |
Mind mapping vs affinity diagram shows a clear distinction. An affinity map focuses on processing existing diverse information, while a mind map focuses on generating and structuring information from a single point.
How to Create An Affinity Diagram?
Creating an affinity diagram is a collaborative and structured process. It is often referred to as the KJ Method after its creator, Jiro Kawakita. The following steps will guide you through the affinity diagram process.
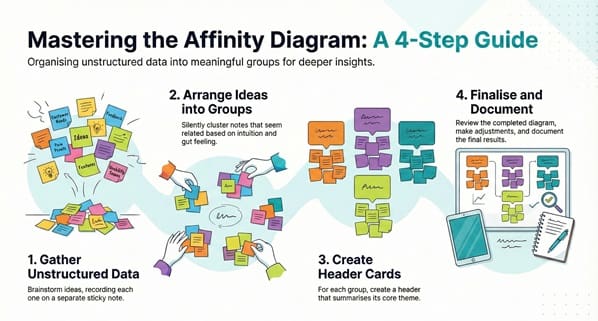
1. Affinity Diagramming: Gather the Unstructured Data
First, you generate the data you need to organize. This is usually done through methods such as brainstorming, collecting customer interviews, or gathering survey responses.
- You must record each idea, fact, or opinion on a separate sticky note or card. Each note should contain only one, clear idea.
- Use simple words and short sentences. Remember, a fifth-grade reading level keeps the content clear for everyone.
- This action leads to a mass of notes, sometimes called the affinity wall or affinity board, which you must now organize.
2. Affinity Grouping: Arrange the Ideas
Next, the team works together—often in silence—to arrange the notes. This phase is crucial for the affinity exercise.
- Start with a note, place it on the workspace, and then ask: Does this note belong with another idea?
- Silently group notes that seem to relate to each other. This is the affinity clustering stage. The focus here is on intuition and gut feeling; do not overthink the placement.
- Continue grouping until all notes belong to a cluster. You will notice some notes may stand alone—these are called singletons.
3. Affinity Maps: Create Header Cards for Each Group
Once you establish the clusters, the team discusses and creates a header card for each group. The goal is to choose a title that summarizes the common theme of all the notes within that cluster.
- The header should effectively define the underlying concept that all the grouped notes share.
- Use action verbs or clear, descriptive nouns in the headers. For example, use “Enhance Data Security” instead of “data security issues.”
- Place the header at the top of the group.
4. Affinity Diagram Example: Finalize and Document
Finally, you review the complete affinity diagram. This final structure, consisting of distinct groups and headers, allows you to analyze the data effectively.
- Review the diagram to ensure all notes are in the most appropriate group. This step often involves adjusting groups or splitting a large one.
- Document the results. You may want to redraw the affinity map digitally or take a clear photo of your physical affinity wall.
- The entire affinity process provides a clear, visual structure for problem-solving.
Where is the Affinity Map Most Applicable?
The use of affinity diagrams is widespread across various professional fields because it is so good at handling complex, unstructured data.
Affinity Diagram in Project Management
In project management, you use the affinity diagram to organize complex project requirements, risks, or causes of a problem.
- Project teams use affinity grouping to analyze stakeholder feedback about a new product feature.
- They use this tool to categorize a list of potential project risks identified during a risk analysis session.
- This facilitates the clear communication of complex issues to project sponsors. The affinity diagram pmp teams use becomes a key planning tool.
UX Affinity Mapping and Design
The User Experience (UX) field uses affinity mapping UX heavily to make sense of user research. This is often called UX affinity diagramming or UX diagramming.
- When a designer collects hundreds of notes from user interviews or usability testing, UX affinity map creation helps find patterns.
- This means that designers group user observations, pain points, or feature requests into themes like “Navigation Issues” or “Desire for Advanced Filtering.”
- The resulting ux affinity diagram directly influences design decisions and prioritization.
Also Read: What Is an Activity Network Diagram?
Affinity Diagram Six Sigma and Quality Improvement
In quality management, especially within the Six Sigma methodology, the affinity diagram is an essential tool.
- It helps in organizing the vast number of potential root causes generated during a problem-solving session.
- This action leads to clear identification of the biggest areas that require improvement focus.
- The affinity analysis makes it possible to quickly see the primary drivers of defects or process inefficiencies.
Now, the Question Arises: When to Use An Affinity Diagram?
You will find the affinity diagram to be the right tool when you face one of these conditions:
- When you have generated a large number of ideas—usually 40 or more—that seem chaotic or disconnected.
- When the issues you are tackling are so complex that the main themes are not clear at first glance.
- When your team needs to achieve consensus on what the major themes or problems are, especially after a group activity.
- When you are starting a project and need to convert raw data (like survey responses) into structured categories for further analysis.
Key Takeaways on the Affinity Diagram
The affinity diagram is a powerful yet simple tool that transforms complex, scattered information into clear, actionable categories.
- It enables you to quickly sort hundreds of ideas into logical groups based on their natural relationships.
- The affinity grouping process ensures that the underlying themes—from user research to project risks—are made visible and understood by everyone.
- When you learn how to make an affinity diagram, you add a vital skill to your problem-solving toolkit, allowing you to move from chaos to clarity efficiently.
By using this technique, you ensure that your team’s decisions are based on a structured understanding of all available information.
Frequently Asked Questions about Affinity Mapping
1. What is the difference between an affinity diagram and brainstorming?
Brainstorming generates a large quantity of ideas, facts, or opinions, often resulting in chaos. Affinity mapping or affinity diagramming is the process you use immediately after brainstorming. It takes those generated ideas and sorts them into logical groups or clusters based on their relationship, helping you make sense of the results.
2. Is the affinity diagram the same as the KJ Method?
Yes, the affinity diagram is often referred to as the KJ Method. This is because Jiro Kawakita created the technique in the 1960s. The KJ analysis or KJ Method refers to the exact, structured process—including the silent grouping—that you use to construct the affinity map.
3. When should I use an affinity diagram instead of a simple list?
You should use an affinity diagram when the data is high in volume (usually 40+ items) and unstructured, or when the underlying themes are not obvious. A simple list works for sequential or few items. The affinity grouping technique is crucial for finding hidden patterns within complex data, such as extensive UX research notes or complex project requirements.
4. Can you create an affinity diagram alone, or is it always a group activity?
While you can create an affinity diagram alone, it is primarily designed as a group activity. Affinity diagramming works best when a diverse team performs the grouping silently. This action leads to a richer identification of relationships and helps build team consensus on the major themes, which is a vital part of the affinity process.
5. What are common headers used in an affinity map?
The headers in an affinity map should be concise, descriptive summaries of the notes in the cluster. They focus on the central theme. Examples include action-oriented phrases like “Improve Onboarding Process,” descriptive categories such as “Customer Service Pain Points,” or technical themes like “Data Security Vulnerabilities.” The header clearly defines what the group of notes comprises.
Final Words
The affinity diagram is an essential tool that allows you to manage information overload by turning large amounts of chaotic data into clear, structured categories. This method, often called affinity mapping, enables teams to efficiently perform affinity grouping, organizing notes and ideas based on natural relationships.
The result is a powerful affinity chart that visually highlights key themes—whether those are project risks, user pain points in UX affinity mapping, or causes in Six Sigma. By mastering how to create an affinity diagram, you gain a systematic way to achieve consensus, understand complexity, and move confidently toward informed decision-making. We ensure your team always operates with maximum clarity.


