
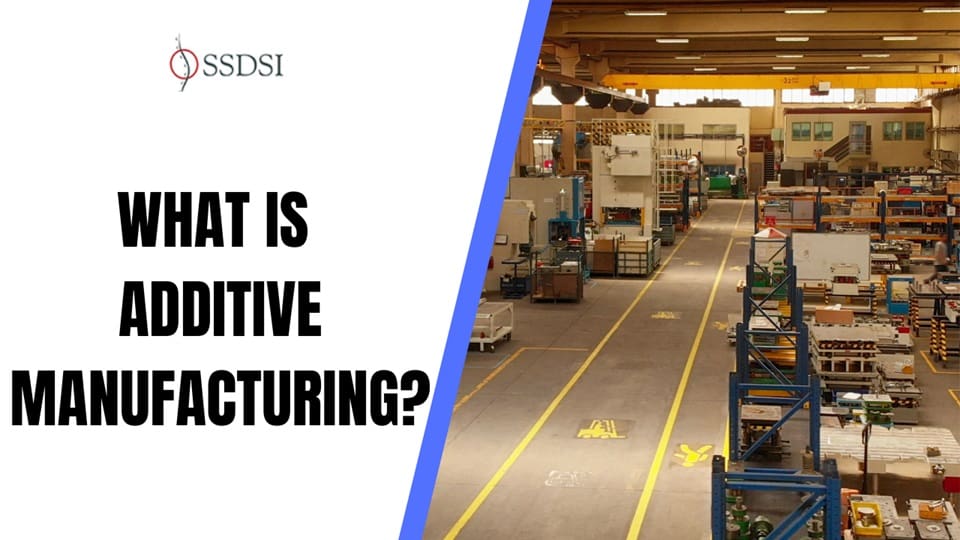
Additive Manufacturing (3D Printing) Explained: Basics & Benefits
Manufacturers create objects in Additive Manufacturing (AM), commonly known as 3D printing, by adding material layer by layer. They control the process using digital data, which eliminates the need for traditional molds or tooling. Because of this, AM allows for a...
Non-Destructive Testing (NDT)
Non-destructive testing (NDT) examines materials, components, or structures for defects without causing any damage. These techniques identify flaws or irregularities while maintaining the integrity of the object being tested. NDT plays a crucial role in maintaining...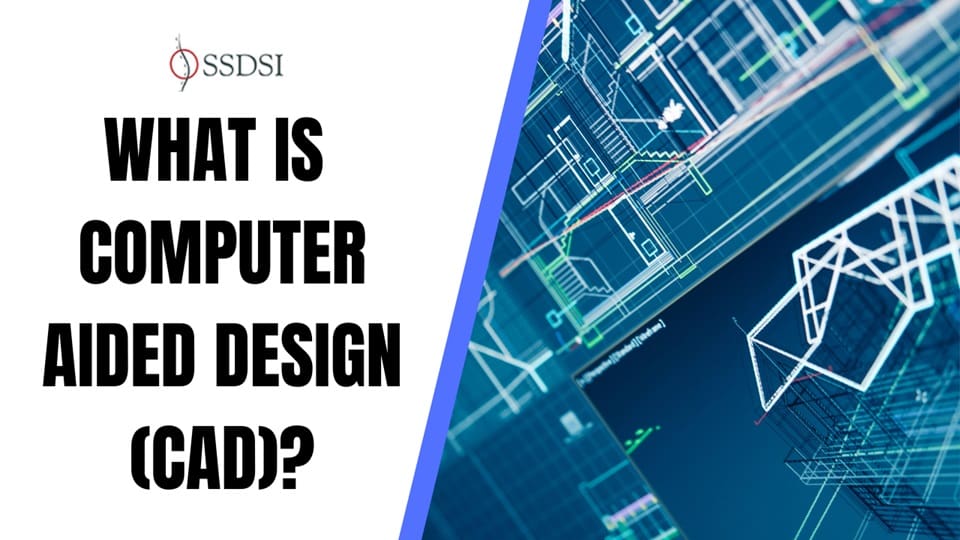
Computer-Aided Design (CAD)
Computer-Aided Design (CAD) is the use of computer systems to assist in the creation, modification, analysis, or optimization of a design. CAD is commonly used in various industries, including architecture, engineering, product design, and manufacturing. It allows for...
What is Planned Obsolescence?
Planned obsolescence refers to intentionally designing and manufacturing products with a limited lifespan. This ensures the product becomes outdated or non-functional after a certain period, compelling consumers to replace it. It is a business strategy that promotes...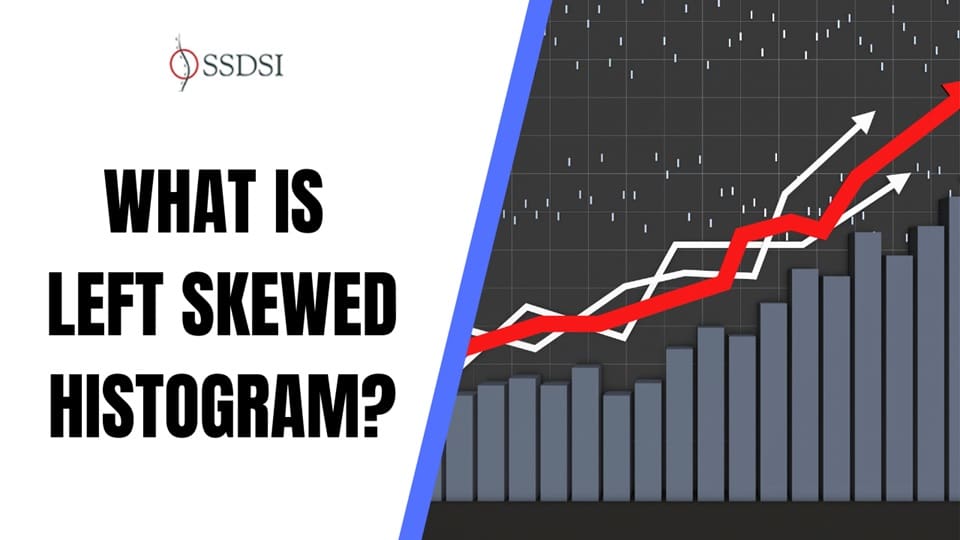
What is a Left-Skewed Histogram?
A histogram is one of the most basic tools in statistics. It helps visualize how data is distributed across different ranges. It provides an easy way to see the shape of the data. However, the distribution of data is not always uniform. It often has a skew, meaning...

ONLINE COURSES:
-
 FAST-TRACK to a Six Sigma Black Belt Certification
$1,996.00
FAST-TRACK to a Six Sigma Black Belt Certification
$1,996.00
-
Online Lean Six Sigma Green Belt Training & Certification
$998.00
-
Online Lean Six Sigma Black Belt Training & Certification
$998.00
-
Online Lean Six Sigma Yellow Belt Training & Certification
$498.00
-
IASSC (International Association for Six Sigma Certification) Practice Exam (100 Questions)
$99.99
-
Lean Six Sigma Green Belt Project Management Kit
Original price was: $298.99.$98.99Current price is: $98.99.
-
Lean Six Sigma Black Belt Project Management Kit
Original price was: $298.99.$98.99Current price is: $98.99.
-
Lean Six Sigma Yellow Belt Project Management Kit
Original price was: $199.98.$58.99Current price is: $58.99.
-
Cause and Effect Matrix Online Training (Complete with Certification)
$29.99
-
Failure Modes and Effects Analysis Online Training (Complete with Certification)
$29.99
-
Lean Six Sigma Root Cause Analysis Online Training (Complete with Certification)
$29.99
-
Lean Six Sigma Project Charter Online Training (Complete with Certification)
$29.99
-
Lean Six Sigma SIPOC Diagram Online Training (Complete with Certification)
$29.99
-
Lean Six Sigma Value Stream Map Online Training (Complete with Certification)
$29.99
-
Lean Six Sigma Input Map Online Training (Complete with Certification)
$29.99
-
FREE Six Sigma White Belt Certification (Online)
Original price was: $99.99.$0.00Current price is: $0.00.


