

Quantum Communication
Quantum communication represents a revolutionary leap forward in secure data transmission, fundamentally transforming how information travels across networks. Unlike traditional communication methods, quantum communication harnesses the peculiar properties of quantum...
Bow-tie Analysis
Bow tie analysis represents a powerful visual risk assessment methodology that helps organizations identify, analyze, and manage potential hazards systematically. This comprehensive approach combines cause-and-effect analysis with consequence evaluation, creating a...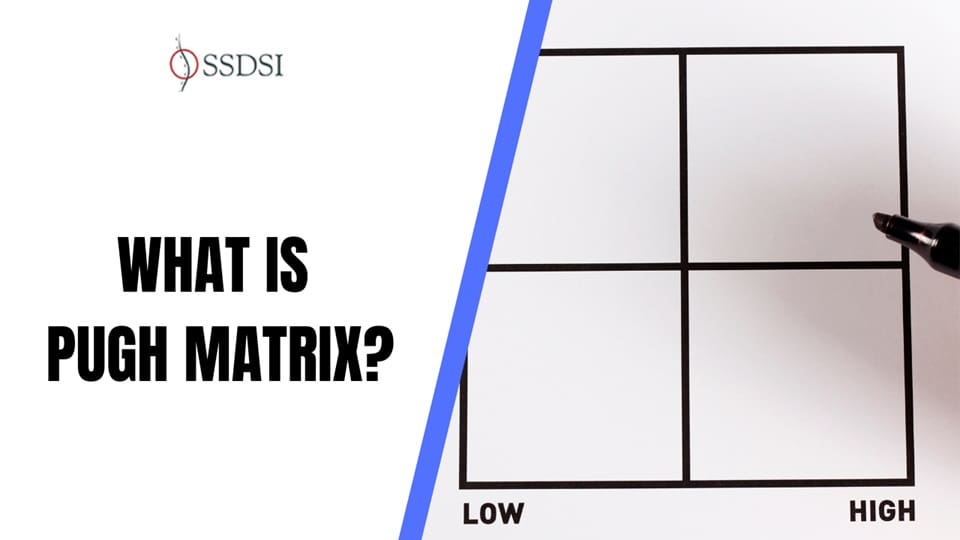
Pugh Matrix
A Pugh Matrix, also known as a decision matrix or Pugh chart, represents a systematic decision-making tool that helps teams evaluate multiple alternatives against predefined criteria. This powerful decision making matrix provides a structured approach for comparing...
Manufacturing Facility Layout
Manufacturing facility layout represents the strategic arrangement of equipment, workstations, storage areas, and personnel within a production environment to maximize efficiency, safety, and productivity. This critical aspect of industrial plant design directly...
Risk Management Information System
A Risk Management Information System (RMIS) represents a sophisticated technology platform designed to streamline and centralize an organization’s entire risk management process. Furthermore, this comprehensive software solution enables businesses to identify,...

ONLINE COURSES:
-
 FAST-TRACK to a Six Sigma Black Belt Certification
$1,996.00
FAST-TRACK to a Six Sigma Black Belt Certification
$1,996.00
-
Online Lean Six Sigma Green Belt Training & Certification
$998.00
-
Online Lean Six Sigma Black Belt Training & Certification
$998.00
-
Online Lean Six Sigma Yellow Belt Training & Certification
$498.00
-
IASSC (International Association for Six Sigma Certification) Practice Exam (100 Questions)
$99.99
-
Lean Six Sigma Black Belt Project Management Kit
Original price was: $298.99.$98.99Current price is: $98.99.
-
Lean Six Sigma Green Belt Project Management Kit
Original price was: $298.99.$98.99Current price is: $98.99.
-
Lean Six Sigma Yellow Belt Project Management Kit
Original price was: $199.98.$58.99Current price is: $58.99.
-
Lean Six Sigma Project Charter Online Training (Complete with Certification)
$29.99
-
Lean Six Sigma SIPOC Diagram Online Training (Complete with Certification)
$29.99
-
Lean Six Sigma Value Stream Map Online Training (Complete with Certification)
$29.99
-
Lean Six Sigma Input Map Online Training (Complete with Certification)
$29.99
-
Cause and Effect Matrix Online Training (Complete with Certification)
$29.99
-
Failure Modes and Effects Analysis Online Training (Complete with Certification)
$29.99
-
Lean Six Sigma Root Cause Analysis Online Training (Complete with Certification)
$29.99
-
FREE Six Sigma White Belt Certification (Online)
Original price was: $99.99.$0.00Current price is: $0.00.


