
Cluster analysis, also known as clustering or numerical taxonomy, classifies objects or cases into groups based on similarities. The technique aims to categorize a set of data points into clusters, where each cluster contains objects that are similar to each other and distinct from objects in other clusters.
The method does not require prior knowledge of the group membership of the data points, making it an unsupervised learning approach. Many fields, including marketing, biology, image processing, and data mining, widely use cluster analysis.
Table of contents
What is Cluster Analysis?
At its core, cluster analysis involves dividing data into groups or clusters where the items within each group share common characteristics. This process is often referred to as “clustering” or “data segmentation.” The objective is to identify natural groupings of items based on some measured characteristic. This helps researchers or analysts gain insights into the data.
Unlike classification techniques, which require predefined groups, cluster analysis does not assume any initial knowledge about the number or structure of the groups. This characteristic makes it a more flexible and exploratory technique. It helps to discover underlying patterns or hidden structures in a dataset without prior assumptions.
The key difference between cluster analysis and classification is that in classification, you already know the number of groups, and you are assigning new data points into one of these groups. In contrast, cluster analysis aims to discover how many groups naturally exist within the data. It then assigns each data point to one of these groups.
These groups form on the basis of concept of similarity or distance, aiming to ensure that items within the same group are more alike, while items in different groups are more dissimilar.
Why Use Cluster Analysis?
Cluster analysis applies in numerous contexts, from marketing to social science, to provide clarity and structure to complex data. For example, in market research, businesses use cluster analysis to segment customers based on buying patterns, allowing them to develop more targeted marketing strategies.
Similarly, in social sciences, researchers use it to categorize individuals based on shared behaviors, opinions, or characteristics.
The practical application of cluster analysis is beneficial in a wide range of areas.It allows investigators to identify distinct patterns within data that were previously unnoticed. Additionally, it helps detect outliers—individuals or data points that deviate significantly from the norm.
Understanding the Concept of Clustering
A cluster is essentially a collection of data objects that are similar to each other within the same group and dissimilar to objects in other clusters. You can determine this similarity based on a range of characteristics or attributes, such as demographic data, purchasing behavior, or physical measurements.
You call the process of grouping these objects clustering, and the goal is to find meaningful patterns or structures within the data.
Applications of Cluster Analysis
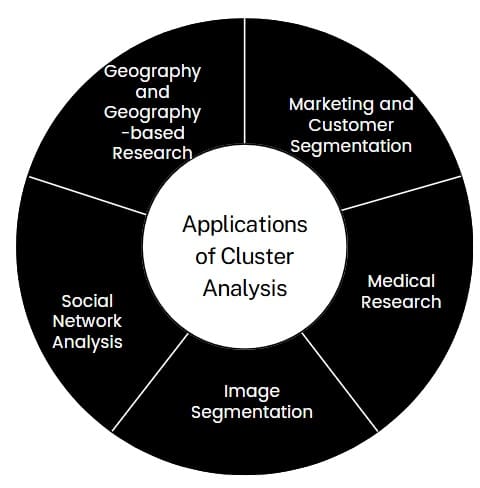
Cluster analysis has numerous applications across various domains:
- Marketing and Customer Segmentation: Businesses use cluster analysis to group customers based on purchasing behavior or demographics. This helps in targeting specific groups with tailored marketing strategies.
- Medical Research: Cluster analysis can identify patient subgroups based on symptoms or genetic data. This aids in personalized medicine and helps develop disease treatment strategies.
- Image Segmentation: In image processing, cluster analysis groups pixels into distinct regions. This facilitates tasks such as object detection or image compression.
- Social Network Analysis: It helps identify communities or groups of users within a larger network based on social interactions or shared interests.
- Geography and Geography-based Research: In studies involving geographical locations, cluster analysis can be invaluable. It helps group similar villages or regions for resource allocation or policy interventions.
Steps and Algorithms in Cluster Analysis
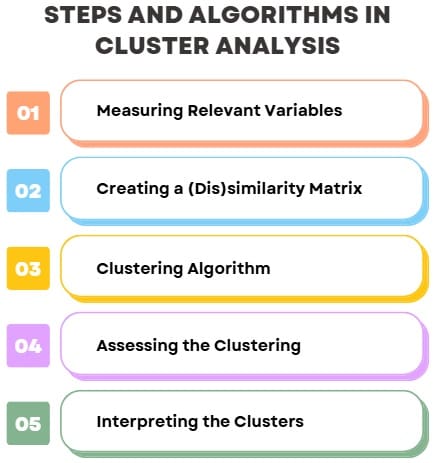
Conducting cluster analysis typically involves a series of steps to organize and understand the data. While different clustering algorithms exist, there are generally five broad steps in any cluster analysis process:
- Measuring Relevant Variables
The first step in cluster analysis involves determining which variables are relevant to the analysis. These variables can be quantitative (such as income or age) or categorical (such as gender or region). You cannot overstate the importance of selecting the correct variables, as the success of clustering largely depends on the quality of the input data. - Creating a (Dis)similarity Matrix
The next step is to create a similarity or dissimilarity matrix. A dissimilarity matrix quantifies how “different” two objects are. For example, if you are clustering customer data based on their purchasing habits, you would calculate how similar two customers are based on their transaction history. The dissimilarity is often measured using different metrics such as Euclidean distance, Manhattan distance, or Minkowski distance.
For example, you can use the Minkowski distance as a general metric to measure the distance between two points in n-dimensional space. Depending on the nature of the data being analyzed, you may apply different metrics. - Clustering Algorithm
Once you create the dissimilarity matrix, you apply a clustering algorithm. One common method is hierarchical clustering. It builds a tree-like structure (a dendrogram) to show how data points group together step by step. Other methods, such as k-means clustering, involve partitioning data into a set number of groups. - Assessing the Clustering
After applying the clustering algorithm, it’s important to assess the results. Are the clusters meaningful? Do they help to explain the relationships in the data? This step involves looking at the results and evaluating whether the clustering makes sense based on your research objectives. - Interpreting the Clusters
Finally, the results must be interpreted in substantive terms. This step is about making sense of the clusters and understanding what they represent in the real world. For example, if you were clustering customers based on purchasing behavior, you would interpret each cluster in terms of customer segments. These could include categories such as budget-conscious shoppers, luxury shoppers, and so on.
Distance Measures in Cluster Analysis
Distance measures are essential in cluster analysis because they quantify how similar or different objects are from each other. Common distance measures include:
- Euclidean Distance: Measures the straight-line distance between two points in Euclidean space. It is the most commonly used distance metric.
- Mahalanobis Distance: Accounts for correlations between variables and is useful for datasets with varying scales or non-identity variance-covariance structures.
These measures help to determine how objects are grouped together in a cluster.
Clustering Procedures
Cluster analysis offers several procedures for grouping data, including hierarchical, non-hierarchical, and two-step procedures. The choice of procedure influences how the clusters are formed and how many clusters are chosen.
Hierarchical Clustering: This method builds a tree-like structure called a dendrogram. It can be either:
- Agglomerative (bottom-up): Starts with individual objects as separate clusters and then successively merges the closest clusters.
- Divisive (top-down): Begins with all data points in a single cluster and recursively splits the clusters into smaller ones.
Agglomerative clustering methods include techniques such as single linkage, complete linkage, and average linkage.
Non-Hierarchical Clustering (K-means): The K-means algorithm is one of the most widely used clustering methods. It divides the dataset into k clusters by iteratively assigning each data point to the nearest cluster center. Then, it updates the centers based on the assignments.
Two-Step Clustering: This method combines the benefits of both hierarchical and non-hierarchical methods. It first performs an initial clustering using a fast clustering method. Then, it refines the clustering using a second technique, often based on a statistical model.
Concepts and Statistics in Cluster Analysis
You use several key concepts and statistical measures to understand and evaluate cluster analysis results:
Cluster Centroid: The centroid of a cluster is the mean of the data points in that cluster. It represents the “center” of the cluster.
Agglomeration Schedule: This refers to a table that records the sequence of merges in hierarchical clustering and shows which objects or clusters you combine at each step.
Dendrogram: A dendrogram is a visual representation of the hierarchical clustering process. It displays the relationship between clusters and shows how you merge them at each step.
Similarity/Dissimilarity Matrix: A matrix that shows the pairwise distances or similarities between each pair of objects in the dataset.
Challenges in Cluster Analysis
Cluster analysis has its challenges, particularly when working with large or complex datasets. Some of these challenges include:
- Choosing the Right Number of Clusters: Determining the optimal number of clusters can be difficult. Techniques like the elbow method or silhouette scores can help, but the choice can still be subjective.
- Handling High Dimensionality: When dealing with data with many attributes, clustering becomes more challenging. As the number of dimensions increases, the data can become sparse, making it harder to find meaningful clusters.
- Scalability: Clustering large datasets can be computationally expensive, and some algorithms may not scale well as the size of the dataset grows.
- Noise and Outliers: Clustering algorithms are sensitive to noise and outliers in the data. Some methods, like DBSCAN, handle outliers more effectively.
Types of Clustering Methods
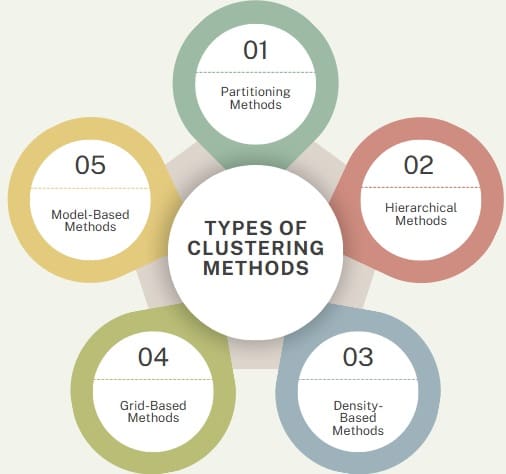
Cluster analysis methods can be broadly classified into the following categories:
- Partitioning Methods: These methods partition the data into k clusters. Examples include K-means and K-medoids. These methods aim to minimize the intra-cluster variance while maximizing the inter-cluster variance.
- Hierarchical Methods: These methods create a hierarchical structure, where each object begins as its own cluster, and you merge clusters iteratively. Examples include agglomerative and divisive methods.
- Density-Based Methods: These methods focus on clusters of varying shapes and densities. A popular method in this category is DBSCAN (Density-Based Spatial Clustering of Applications with Noise), which identifies clusters of arbitrary shapes and effectively handles noise and outliers.
- Grid-Based Methods: Grid-based methods divide the data space into a finite number of cells. These methods tend to be faster, especially for large datasets. This is because the computation is independent of the number of data points and only depends on the number of cells in each dimension.
- Model-Based Methods: These methods assume that a specific model generates the data. Their goal is to fit the best model to the data, which you can then use for clustering. Examples include the Gaussian Mixture Model (GMM).
Final Words
Cluster analysis is a powerful tool for discovering patterns and structures within data. By grouping similar objects together, you gain insights that you can apply in various fields, from marketing to biology to data mining. However, selecting the appropriate clustering method and determining the optimal number of clusters require careful consideration. Additionally, dealing with challenges like noise and high-dimensionality also demands expertise.
Moreover, as the field of machine learning and data analysis continues to grow, cluster analysis remains a fundamental technique. It plays a crucial role in extracting meaningful insights from complex data.


