Most of our decisions in our day to day life relies on incomplete information. For example, when you board a bus, you expect it to take you to your destination and not not to a place which is completely unknown to you. This belief is depends on past experiences and observations, like the bus’s route and the sign on the bus.
Hence we could say that, it is not necessary that we have complete certainity everytime we make a decision but still we rely on the information to make a rational guess. This applies to everything from everyday situations to complex scientific problems. However, where our intuition do not work —like in science—we need a more structured way to handle uncertainty. In this way Bayesian statistics comes into play.
Bayesian statistics is a branch of statistics. It interprets probability as a measure of belief or certainty about an event, rather than just the long-term frequency of occurrence.
Unlike the frequentist approach, which treats parameters as fixed but unknown, Bayesian statistics considers them random variables with specific probability distributions. This method relies heavily on Bayes’ Rule. It is a mathematical formula that updates probabilities based on new evidence.
Table of contents
What is Bayesian Statistics?
Bayesian statistics is a way of thinking about and handling uncertainty. It allows us to use probabilities to describe how likely we think something is to be true, depending upon the information we have. Precisely, it also provides a method to update these probabilities, in case we get new information.
In essence, Bayesian statistics helps us answer questions like:
- How likely is a new treatment to work better than the old one?
- What are the chances a hypothesis is true, given the evidence?
So we can say that Bayesian statistics is the concept of expressing knowledge and uncertainty about unknown events or parameters in terms of probability.
What Is a Proposition?
A proposition is any statement that can be either true or false. For example:
- E = A major earthquake will occur in Europe in the next ten years.
Since the truth of this proposition is unknown, Bayesian statistics assigns a probability, P(E), to represent the likelihood that E is true.

These probabilities are not fixed; they get updated when new data or information becomes available. This process of updating beliefs is central to Bayesian analysis. Further, it relies on Bayes’ theorem, which we will explore later.
Certainty, Uncertainty, and Probability
Probability in Bayesian terms is a measure of how sure we are about something:
- A probability of 1 means you are completely certain something is true.
- A probability of 0 means you are sure it is false.
- A probability of 0.5 means you are entirely unsure, like flipping a fair coin.
For example, Suppose during a quiz a candidate guesses the answer a question, they might say, “I’m 75% sure it’s A.” This reflects their level of certainty based on what they know.
In Bayesian thinking, probabilities are subjective—they depend on what you know. If you have more information than someone else, your probabilities might be different. Further, as new evidence is received, you should adjust your probabilities accordingly.
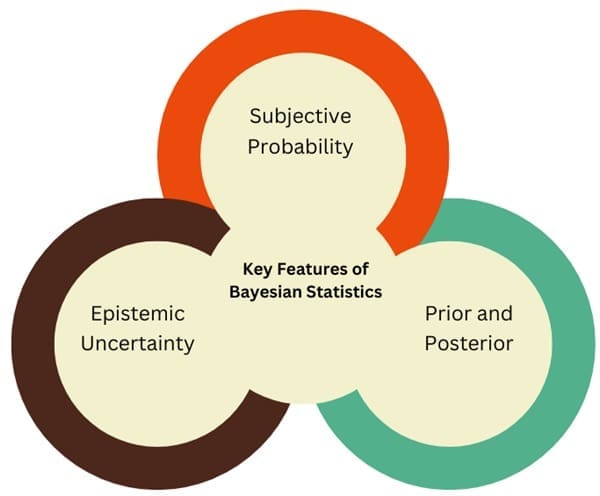
Key Features of Bayesian Statistics

1. Subjective Probability
Bayesian probability represents the degree of belief in an event’s occurrence. For instance:
- Frequentist Approach: It focuses on the long-term relative frequency of events.
- Bayesian Approach: It considers personal belief, even for non-repetitive events like the likelihood of a political candidate winning an election.
2. Prior and Posterior
- Prior: It represents our initial knowledge or assumption regarding a parameter before observing data.
- Posterior: It updates the prior using new evidence, combining both to reflect the updated belief.
3. Epistemic Uncertainty
Bayesian statistics explicitly acknowledges uncertainty. Parameters are treated as probabilistic variables, unlike frequentist statistics, which assumes they are fixed but unknown.
Bayesian Inference
Bayesian inference extends Bayes’ theorem to estimate unknown parameters based on observed data. The process involves:
- Prior Belief, i.e. Initial knowledge about the parameter.
- Likelihood, i.e. Probability of observed data given the parameter.
- Posterior Belief, i.e. Updated knowledge about the parameter after considering the data.
Framework

Example: Coin Toss
Suppose we suspect a coin is biased. Initially, we believe:

After tossing the coin 10 times and getting 7 heads, Bayesian inference updates the probability of the coin being biased.
Bayesian Updating
The basic idea behind Bayesian statistics is updating your beliefs when new evidence appears. Let’s say you’re on a quiz show and unsure about the answer to a question. You think there’s a 25% chance the answer is A. But then you use a lifeline, and your friend says they’re sure the answer is A. Now, with this new information, your belief in A being correct will increase—perhaps to 90%.
This process of adjusting probabilities is the core of Bayesian statistics. The more evidence you collect, the more refined your beliefs become.
Also See: Lean Six Sigma Certification Programs, Buffalo, New York
Example
Imagine you have a bag containing two balls. You know that at least one of them is black, but you’re unsure if:
- Both balls are black (Hypothesis BB), or
- One is black and the other is white (Hypothesis BW).
To find out, you randomly draw one ball from the bag and observe its color. The result: the ball is black.
Step 1: Define Prior Probabilities
Before drawing the ball, you assign equal chances to each hypothesis:
- Probability of BB: 50% (0.5)
- Probability of BW: 50% (0.5)
Step 2: Calculate the Likelihood
The likelihood is the chance of observing the evidence (drawing a black ball) under each hypothesis:
- If BB is true (both balls are black), the chance of drawing a black ball is 100% (1).
- If BW is true (one black ball and one white ball), the chance of drawing a black ball is 50% (0.5).
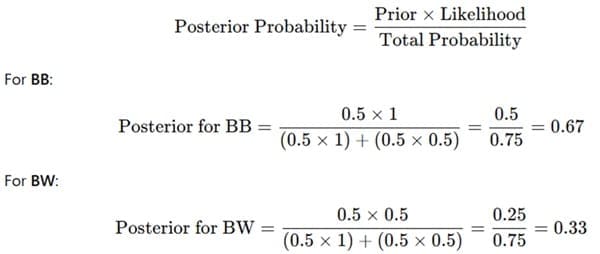
Step 3: Update Probabilities (Posterior Probabilities)
To update our beliefs, we combine the prior probabilities with the likelihoods. Bayesian statistics uses a formula to do this:

After seeing the black ball, the updated probabilities are:
- BB: 67% chance
- BW: 33% chance
This means it’s more likely both balls are black, but there’s still a chance one is white.
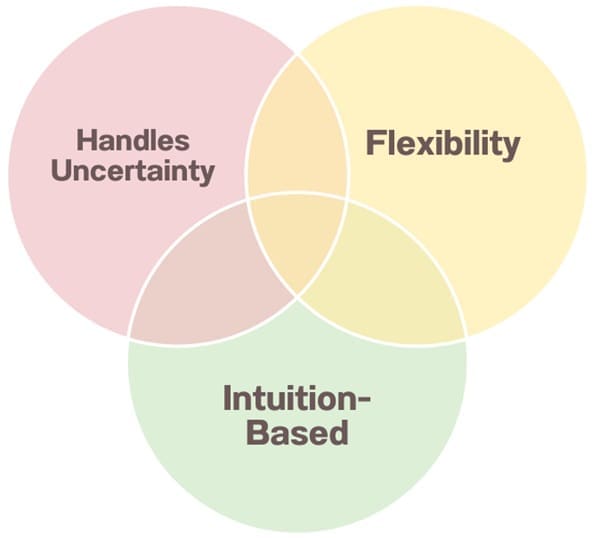
Advantages of Bayesian Statistics

- Flexibility: Bayesian methods can be applied to a wide range of problems, from simple ones to complex data analysis.
- Intuition-Based: It aligns with how humans naturally think—updating beliefs based on new evidence.
- Handles Uncertainty: It explicitly accounts for uncertainty, making it particularly useful in science and decision-making.
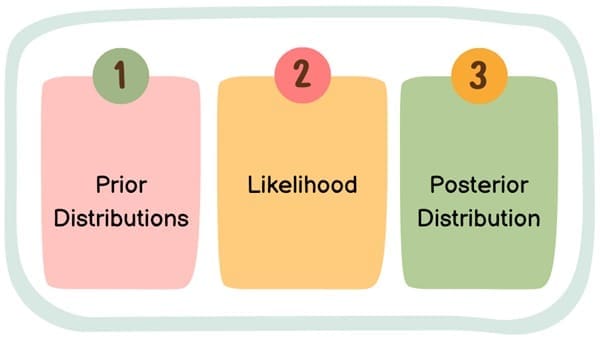
Components and Techniques of Bayesian Statistical Analysis

1. Prior Distributions
The choice of prior significantly influences Bayesian analysis. Priors can be:
- Informative: Based on substantial prior knowledge.
- Non-informative: Neutral or vague, allowing data to dominate the analysis.
2. Likelihood
This represents how likely the observed data is given specific parameter values. For example, a binomial distribution may describe the likelihood of observing successes in a set of trials.
3. Posterior Distribution
The posterior combines prior and likelihood. It summarizes all available knowledge about a parameter after observing data. Posterior distributions are often used for:
- Hypothesis testing.
- Prediction.
- Model comparison.
Applications of Bayesian Statistics
- Medical Decision-Making Bayesian reasoning helps assess treatment effectiveness, interpret diagnostic tests, and plan clinical trials.
- Machine Learning Bayesian models are foundational in fields like natural language processing, image recognition, and predictive analytics.
- Forecasting Bayesian approaches are used for weather predictions, economic modelling, and risk assessment.
- Scientific Research Bayesian methods offer flexibility for analyzing complex data and quantifying uncertainty.
Difference Between Frequentist and Bayesian
| Aspect | Frequentist | Bayesian |
| Interpretation | Probabilities as long-run frequencies. | Probabilities as degrees of belief. |
| Parameters | Fixed, unknown constants. | Random variables with distributions. |
| Inference Basis | Data randomness due to sampling variation. | Updates beliefs using Bayes’ Rule. |
| Example Statement | “The parameter lies within a confidence interval in repeated sampling.” | “The posterior probability of the parameter is 90% given the observed data.” |
Final Words
Bayesian statistics provides a systematic way to deal with uncertainty. When we combine what we know (prior probabilities) with new evidence (likelihood), we can refine our understanding of the world and make better decisions. Whether you’re solving a simple problem or tackling a complex scientific question, Bayesian methods offer a powerful framework for reasoning under uncertainty.

About Six Sigma Development Solutions, Inc.
Six Sigma Development Solutions, Inc. offers onsite, public, and virtual Lean Six Sigma certification training. We are an Accredited Training Organization by the IASSC (International Association of Six Sigma Certification). We offer Lean Six Sigma Green Belt, Black Belt, and Yellow Belt, as well as LEAN certifications.
Book a Call and Let us know how we can help meet your training needs.


