
In statistics, the Z-value, or Z-score, is a powerful tool that allows us to measure how far a particular data point is from the mean of a distribution. It does this by expressing the difference between a data point and the mean in terms of standard deviations. In simpler terms, the Z-value shows how many standard deviations a value is above or below the mean.
The Z-value is beneficial when comparing data points from different normal distributions. Since it standardizes data, it allows for easier comparison across datasets that may have different units or scales. Z-scores are used extensively in statistical analysis, hypothesis testing, and quality control.
This guide will explain what Z-values are, how they are calculated, how they are interpreted, and their many applications in statistics and beyond.
Table of contents
What is a Z-Value?
The Z-value is a number that describes how far a specific data point is from the mean of the dataset. It is measured in terms of the standard deviation. A Z-value tells you whether a data point is above or below the mean and by how much. If you have a dataset with a known mean and standard deviation, you can calculate the Z-value for any data point.
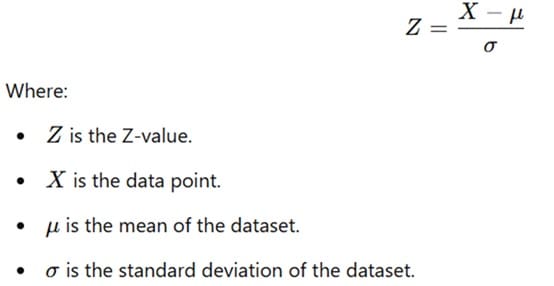
The formula to calculate the Z-value is:
The Z-value gives us a standardized measure of where a specific data point stands relative to the overall distribution.
In statistics, a z-value (also called a z-score or standard score) represents the number of standard deviations a data point is from the mean of a distribution.
It’s a way to standardize data, making it easier to compare values from different datasets or to assess how unusual a particular data point is.
Here’s a breakdown of what a z-value means:
Key Concepts
- Mean (μ): The average of a dataset.
- Standard Deviation (σ): A measure of how spread out the data is.
- Z-score Formula:
o z = (x – μ) / σ
Where:
z is the z-score
x is the data point
μ is the mean of the dataset
σ is the standard deviation of the dataset
Interpretation of Z-values
- Positive Z-value: Indicates the data point is above the mean.
- Negative Z-value: Indicates the data point is below the mean.
- Z-value of 0: Indicates the data point is equal to the mean.
- Magnitude of Z-value: The larger the absolute value of the z-score, the further the data point is from the mean, and therefore, the more unusual it is.
Why Z-values Are Important?
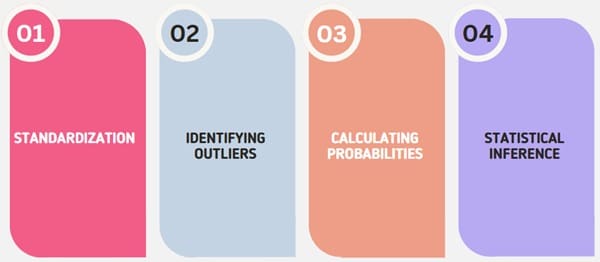
- Standardization: Z-scores allow you to compare data from different distributions. For instance, you can compare a student’s score on two different tests, even if the tests had different means and standard deviations.
- Identifying Outliers: Z-scores can help identify outliers, which are data points that are significantly different from the rest of the data. Typically, z-scores greater than +3 or less than -3 are considered outliers.
- Calculating Probabilities: Z-scores are used to calculate probabilities in a standard normal distribution. Using a z-table or statistical software, you can determine the probability of a data point falling within a certain range.
- Statistical Inference: Z-scores play a role in hypothesis testing, allowing you to determine if a sample mean is significantly different from a population mean.
Example
Suppose you have a dataset with a mean (μ) of 50 and a standard deviation (σ) of 10. If you have a data point (x) of 70, the z-score would be:
z = (70 – 50) / 10 = 2
This means that the data point 70 is 2 standard deviations above the mean.
How to Calculate a Z-Value?

To calculate the Z-value, follow these steps:
- Identify the data point: First, you need to know the data point XXX you are analyzing.
- Calculate the mean: The mean μ\muμ is the average of all data points in the dataset.
- Calculate the standard deviation: The standard deviation σ\sigmaσ tells you how spread out the data points are from the mean.
- Apply the Z-value formula: Subtract the mean from the data point and divide by the standard deviation.
Let’s use an example for clarity. Suppose the mean of a class’s test scores is 75, with a standard deviation of 5. If a student scored 85 on the test, the Z-value would be calculated as follows:
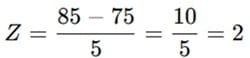
This means the student’s score is 2 standard deviations above the mean.
Interpreting Z-Values
The Z-value provides important information about the position of a data point in a distribution:
- A Z-value of 0 indicates the data point is exactly at the mean.
- A positive Z-value means the data point is above the mean. For example, a Z-value of 2 means the data point is 2 standard deviations above the mean.
- A negative Z-value indicates the data point is below the mean. For example, a Z-value of -1 means the data point is 1 standard deviation below the mean.
In general:
- Z-values between -1 and 1 indicate data points that are close to the mean.
- Z-values greater than 1 or less than -1 suggest that the data point is farther away from the mean and may be considered an outlier if the value is extreme enough.
Standard Normal Distribution and Z-Values
The Standard Normal Distribution is a specific case of the normal distribution where the mean is 0 and the standard deviation is 1. The Z-value essentially transforms a normal distribution into the standard normal distribution. This transformation allows us to compare data points from different datasets, even if the datasets have different means and standard deviations.
The standard normal distribution has a bell curve shape, and the Z-value tells you where the data point falls along this curve.
For example:
- A Z-value of 1 corresponds to a data point that is 1 standard deviation above the mean.
- A Z-value of -2 corresponds to a data point that is 2 standard deviations below the mean.
Using the Z-value and the standard normal distribution, you can calculate probabilities and assess the likelihood of a data point occurring within a specific range.
Z-Table and Probability
A Z-table (also known as the standard normal table) provides the cumulative probability associated with different Z-values. This means that for any given Z-value, you can use the table to determine the percentage of values that lie below it in a normal distribution.
For instance, if you have a Z-value of 1.96, you can look up this value in the Z-table to find the corresponding cumulative probability. A Z-value of 1.96 corresponds to approximately 97.5% of the data being below this value. This is commonly used in statistical tests to find confidence intervals and significance levels.
In practice, you may need to use a Z-table to find probabilities for values greater than the mean (positive Z-values) or less than the mean (negative Z-values). Z-tables are widely used in hypothesis testing, confidence interval calculations, and other statistical analyses.
Applications of Z-Values

The Z-value is a versatile tool used across many fields of study. Some of the primary applications include:
Standardizing Scores
In education, Z-values are used to standardize test scores across different groups. This helps compare scores from different exams, even when the exams have different difficulty levels. Z-scores allow educators and researchers to see how well students performed relative to the overall group, regardless of the specific test.
Identifying Outliers
Z-values help identify outliers in data. Any data point with a Z-value greater than 3 or less than -3 is typically considered an outlier. Outliers are data points that are unusually far from the mean and may indicate something unusual or incorrect in the dataset.
Quality Control
In manufacturing and industrial settings, Z-values are used in quality control to measure the consistency of products. If the Z-value of a sample product is too high or too low, it may indicate a defect or problem with the production process.
Hypothesis Testing
Z-values are central to hypothesis testing, particularly in the context of Z-tests. Z-tests use the Z-value to determine if a sample mean is significantly different from the population mean. This is commonly used in statistical inference and helps researchers draw conclusions about populations based on sample data.
Risk Assessment and Finance
In finance, Z-scores are used to assess the risk of bankruptcy in companies. The Altman Z-score, for example, is a formula used to predict the likelihood of a company going bankrupt. The Z-score in this context takes into account various financial ratios to assess financial health.
Z-Value in Practice: Z-Test
One of the most common uses of the Z-value is in the Z-test. A Z-test is a type of hypothesis test that is used to determine whether there is a significant difference between a sample mean and a population mean, given a known standard deviation.
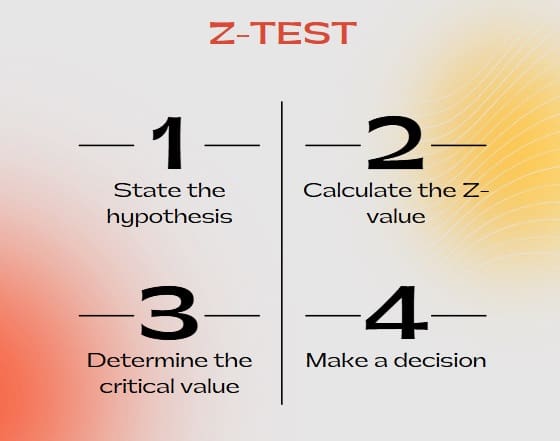
The general process of a Z-test involves the following steps:
- State the hypothesis: Formulate the null and alternative hypotheses.
- Calculate the Z-value: Use the Z-score formula to find the Z-value.
- Determine the critical value: From a Z-table, find the critical value for the desired significance level.
- Make a decision: Compare the calculated Z-value to the critical value. If the Z-value is greater than the critical value, reject the null hypothesis.
Limitations of Z-Values
While Z-values are useful, they do have some limitations:
Assumption of Normality
The Z-value assumes that the data follows a normal distribution. In cases where the data is skewed or non-normal, the Z-value may not accurately reflect the data’s true position.
Sensitivity to Outliers
Extreme outliers can significantly affect the mean and standard deviation. This, in turn, can lead to misleading Z-scores. It’s important to consider the overall data distribution and check for outliers before using Z-values.
Final Words
The Z-value is a crucial tool in statistics, providing a standardized way to understand data relative to its mean. It helps in comparing data points across different distributions and is widely used in fields like education, quality control, finance, and hypothesis testing.
By calculating the Z-value, we can determine how far a data point lies from the mean in terms of standard deviations, which helps in identifying outliers, making inferences, and drawing conclusions about a dataset. However, it is important to understand the limitations of the Z-value, particularly when dealing with non-normal data or extreme outliers.
The Z-value is an essential concept in statistics that plays a vital role in data analysis, hypothesis testing, and real-world applications.


