
A z-score tells you how many standard deviations a value sits from the mean. A z-score of 0 means the value equals the mean. A z-score of 2 means the value sits two standard deviations above the mean. A z-score of negative 1.5 means the value sits one and a half standard deviations below the mean. The formula is simple: subtract the mean from your value, then divide by the standard deviation.
Six Sigma teams use z-scores constantly. They convert raw process measurements into a shared scale, which lets a team calculate defect probability, compare performance across different processes, and connect a process directly to its sigma level.
Quick-Reference Table: Z-Score at a Glance
| Concept | Meaning |
| Z-score | Number of standard deviations a value sits from the mean |
| Formula | z = (x minus the mean) divided by the standard deviation |
| Positive z-score | Value sits above the mean |
| Negative z-score | Value sits below the mean |
| Z-score of 0 | Value equals the mean exactly |
| Common use in Six Sigma | Calculating sigma level, defect probability, and process capability |
Table of contents
Key Takeaways
- A z-score standardizes any measurement onto one shared scale. This lets you compare very different processes using the same number system.
- The formula only needs three inputs. You need the raw value, the mean, and the standard deviation.
- A z-score connects directly to probability. Once you have a z-score, a standard normal table tells you exactly what percentage of data falls above or below that point.
- Six Sigma uses z-scores to calculate sigma level. A process running at six sigma keeps its defect rate at an extremely low z-score threshold.
- The 1.5 sigma shift is a key Six Sigma adjustment. Real processes drift over time, so practitioners often subtract 1.5 from a short-term z-score to estimate long-term performance.
- Z-scores require a normal distribution to work correctly. Applying this formula to heavily skewed data can produce misleading results.
What Is a Z-Score?
A z-score measures distance from the mean, expressed in standard deviations instead of raw units. This single change makes it possible to compare numbers that would otherwise mean nothing next to each other.
Consider two students. One scores 85 on a test with a mean of 75 and a standard deviation of 5. Another scores 180 on a different test with a mean of 150 and a standard deviation of 20. Which student performed better relative to their own test? Raw scores cannot answer this. Z-scores can.
The Z-Score Formula, Explained Simply
The formula for a z-score is:
z = (x minus mu) divided by sigma
Here is what each part means:
- x is the raw value you want to convert.
- mu (the Greek letter mu) is the mean of the full population.
- sigma (the Greek letter sigma) is the standard deviation of the full population.
When you only have a sample instead of the full population, you use the sample mean and sample standard deviation as estimates. This produces the same basic result, though statisticians sometimes call the sample-based version a t-statistic instead, particularly with small sample sizes.

Public, Onsite, Virtual, and Online Six Sigma Certification Training!
- We are accredited by the IASSC.
- Live Public Training at 52 Sites.
- Live Virtual Training.
- Onsite Training (at your organization).
- Interactive Online (self-paced) training,
A Worked Example: Comparing Two Test Scores
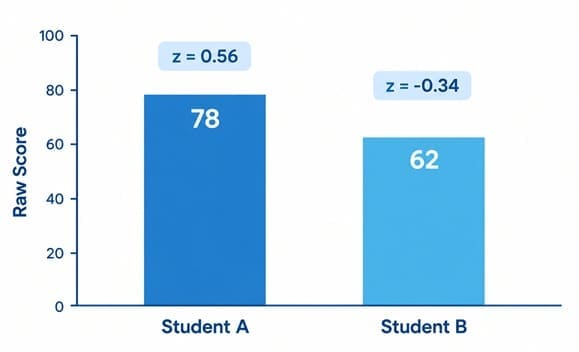
Return to the two students from earlier.
Student A: Scored 85, mean of 75, standard deviation of 5.
z = (85 minus 75) divided by 5 = 2.0
Student B: Scored 180, mean of 150, standard deviation of 20.
z = (180 minus 150) divided by 20 = 1.5
Student A’s z-score of 2.0 is higher than Student B’s z-score of 1.5. Even though Student B’s raw score was much bigger, Student A actually performed better relative to their own test’s typical results. This is the entire value of a z-score: it strips away the units and puts every measurement on the same footing.
Why Z-Scores Matter in Six Sigma
Six Sigma leans on z-scores heavily, for one main reason. A process almost never gets measured against a fixed number. It gets measured against how consistently it stays within specification limits. Z-scores turn that consistency question into a precise, calculable number.
Here is how this plays out in practice.
Calculating defect probability. Once you convert a specification limit into a z-score, a standard normal table tells you exactly what percentage of output falls outside that limit. This is how a team calculates a predicted defect rate before ever counting a single actual defect.
Determining sigma level. A process’s sigma level describes how many standard deviations fit between the process mean and its nearest specification limit. A six sigma process fits six standard deviations of room before hitting a specification limit, which translates into an extremely low defect rate.
Comparing dissimilar processes. A defect rate in a manufacturing line and an error rate in a billing department use completely different units. Converting both to a z-score, or the related sigma level, allows a company to compare their performance on one shared scale.
The 1.5 Sigma Shift: A Six Sigma-Specific Adjustment
This is one of the most misunderstood ideas in Six Sigma, and it deserves a clear explanation. Motorola engineers, who developed the Six Sigma methodology, observed that real processes drift over long periods of time, even when they appear stable in a short study.
To account for this drift, Six Sigma practitioners commonly subtract 1.5 from a short-term z-score to estimate a more realistic long-term sigma level.
| Sigma Level (Short Term) | Long-Term Sigma Level (After 1.5 Shift) | Defects Per Million Opportunities |
| 6.0 | 4.5 | 3.4 |
| 5.0 | 3.5 | 233 |
| 4.0 | 2.5 | 6,210 |
| 3.0 | 1.5 | 66,807 |
This is why a “six sigma” process is often described as having 3.4 defects per million opportunities, even though a true 6.0 z-score would predict a far lower defect rate. The 1.5 shift builds in a realistic safety margin for the process drift that happens naturally over time.
Also Read: What Is a Klout Score?
How to Use a Z-Score to Find a Defect Probability
Follow these steps to convert a raw measurement into a predicted defect probability.
- Gather your process data. You need the process mean, the process standard deviation, and the specification limit you care about.
- Calculate the z-score. Subtract the mean from the specification limit, then divide by the standard deviation.
- Look up the z-score in a standard normal table. This table converts your z-score into the percentage of the distribution falling beyond that point.
- Convert that percentage into a defect rate. Multiply by one million to express the result as defects per million opportunities, if that format is useful for your comparison.
A Practical Example: Calculating Defect Probability
A process fills bottles with a target volume of 500 mL. The process mean is 500 mL, with a standard deviation of 4 mL. The upper specification limit is 512 mL.
Step 1: Calculate the z-score.
z = (512 minus 500) divided by 4 = 3.0
Step 2: Look up this z-score. A z-score of 3.0 corresponds to roughly 0.135 percent of the distribution falling above that point.
Step 3: Interpret the result. About 0.135 percent of bottles are predicted to exceed the upper specification limit, based purely on this z-score calculation, before anyone measures a single actual bottle.
This calculation lets a team predict defect rates from historical process data, without waiting to collect a fresh batch of defect counts.
Z-Score vs. T-Score: Knowing Which One to Use
These two terms get confused often, and the distinction matters for accurate analysis.
| Statistic | Used When | Requires |
| Z-score | The true population mean and standard deviation are known | Large sample size, or a fully measured population |
| T-score | Only a sample mean and sample standard deviation are available | Small sample size, unknown population parameters |
In most real Six Sigma projects, a team only has sample data, not full population data. Strictly speaking, this often calls for a t-statistic rather than a true z-score. In practice, once a sample grows large enough (commonly 30 or more observations), the t-distribution and the normal distribution become close enough that many practitioners use the terms somewhat interchangeably, even though the strict statistical distinction still exists.
Also Read: Balanced Scorecard: Definition, Four Perspectives, and How It Connects to Six Sigma
Common Mistakes When Using Z-Scores
Applying a z-score to non-normal data. The entire z-score and standard normal table system assumes the underlying data follows a normal, bell-shaped distribution. Skewed or heavily non-normal data can produce a misleading probability estimate.
Confusing short-term and long-term sigma level. Forgetting to apply the 1.5 sigma shift, or applying it when it should not be applied, produces a sigma level that does not match how the process actually performs over time.
Using population formulas on sample data. When only a sample is available, using the true population version of the z-score formula, instead of the sample-adjusted version, can overstate confidence in the result.
Treating a single z-score as the whole story. A z-score calculated from one specification limit ignores what happens at the other limit. A two-sided tolerance requires calculating z-scores for both the upper and lower limits separately.
Frequently Asked Questions on Z-Score in Six Sigma
What does a z-score tell you?
A z-score tells you how many standard deviations a specific value sits from the mean of its distribution. A positive z-score means the value sits above the mean, and a negative z-score means it sits below the mean.
What is the formula for a z-score?
The formula subtracts the mean from your raw value, then divides that result by the standard deviation. Written as an equation, it reads z equals x minus mu, divided by sigma.
How is a z-score used in Six Sigma?
Six Sigma uses z-scores to calculate a process’s sigma level, predict defect probability from specification limits, and compare performance across processes that use completely different units of measurement.
What is the 1.5 sigma shift?
The 1.5 sigma shift is an adjustment Six Sigma practitioners apply to a short-term z-score to estimate long-term process performance, accounting for the natural drift that real processes experience over time.
What is the difference between a z-score and a t-score?
A z-score requires knowing the true population mean and standard deviation. A t-score is used instead when only a sample mean and sample standard deviation are available, which is the more common situation in real process data.
Can you calculate a z-score without a normal distribution?
You can calculate the number mathematically, but the standard interpretation, using a standard normal table to estimate probability, assumes the underlying data follows a normal distribution. Applying this to heavily skewed data can produce an inaccurate probability estimate.
What does a z-score of 3 mean in a process?
A z-score of 3 means a specification limit sits three standard deviations from the process mean. Based on the standard normal distribution, this corresponds to roughly 0.135 percent of output falling beyond that limit.
Final Words
A z-score solves a simple but powerful problem: it converts any raw measurement into a shared, comparable scale based on standard deviations from the mean. That shared scale is exactly what makes it possible to calculate defect probability, determine sigma level, and compare wildly different processes side by side.
In Six Sigma specifically, the z-score becomes the mathematical bridge between raw process data and a defensible statement like “this process runs at four sigma.” Understanding the formula, and the important 1.5 sigma shift adjustment, is a foundational skill for anyone doing real statistical process analysis.
Build Your Statistical Foundation with SSDSI
Z-scores sit at the center of how Six Sigma calculates sigma level, process capability, and defect probability. SSDSI delivers IASSC-accredited Green Belt and Black Belt training that covers z-scores, the standard normal distribution, and the statistical foundation behind every DMAIC project, through onsite, live virtual, public, and self-paced formats.
SSDSI has certified 5,322+ professionals across 600+ organizations in 52 cities, backed by a 5-star Google review rating. If you want to build this statistical foundation properly, a conversation about the right certification path is a solid next step.
About Six Sigma Development Solutions, Inc.
Six Sigma Development Solutions, Inc. offers onsite, public, and virtual Lean Six Sigma certification training. We are an Accredited Training Organization by the IASSC (International Association of Six Sigma Certification). We offer Lean Six Sigma Green Belt, Black Belt, and Yellow Belt, as well as LEAN certifications.
Book a Call and Let us know how we can help meet your training needs.


