Table of Contents
What is Visio Process Mapping?
A Visio process flow diagram or Visio process mapping refers to the use of Microsoft Visio, a popular diagramming and flowcharting software, to create visual representations of business processes, workflows, and systems. Process mapping is a crucial tool for businesses and organizations to document, analyze, and communicate their processes effectively.
Here are some key aspects of Visio process mapping:
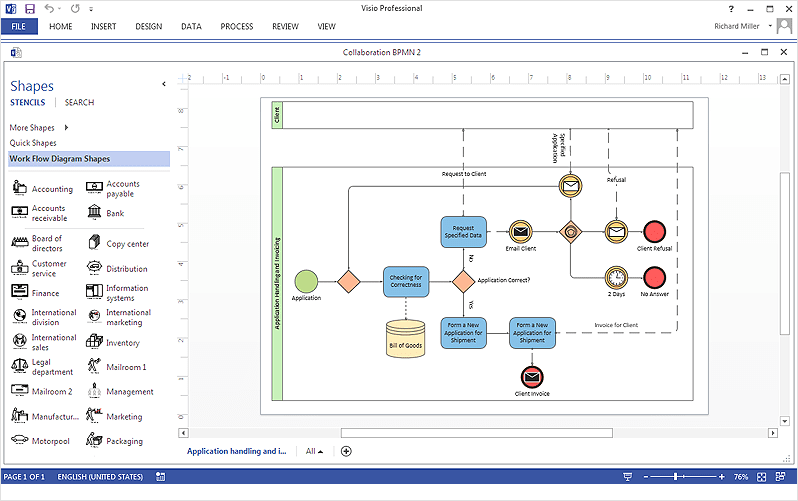
- Diagram Creation: Visio provides a user-friendly interface for creating various types of diagrams, including flowcharts, process maps, swimlane diagrams, and process flow diagrams on Visio. Users can drag and drop shapes and connectors to design process maps.
- Symbol Libraries: Visio comes with a wide range of built-in symbols and templates specific to process mapping. These symbols represent different elements in a process, such as start and end points, decision points, activities, inputs, outputs, and connectors.
- Flowcharting: Visio is particularly well-suited for creating flowcharts, which are commonly used for process mapping. Users can define the flow of a process step by step, connecting shapes and adding text to describe each step or decision.
- Data Integration: Depending on the version of Visio, you may have the ability to integrate data from external sources, like Excel or databases, into your process maps. This can be useful for creating dynamic diagrams that update automatically when the underlying data changes.
- Collaboration: Visio allows for collaboration on process maps. Multiple team members can work on a diagram simultaneously, and comments and annotations can be added to enhance communication and understanding.
- Documentation: Process maps created in Visio serve as valuable documentation for standardizing and improving processes within an organization. They provide a clear visual representation that can help identify bottlenecks, inefficiencies, and areas for improvement.
- Presentation: Visio diagrams can be easily incorporated into presentations, reports, and documentation to convey complex processes in a more understandable and visually appealing way.
- Export and Sharing: Visio diagrams can be exported in various formats, including PDF and image files, making it easy to share them with stakeholders who may not have Visio installed.
Overall, Visio process mapping is a powerful tool for businesses and organizations to model, analyze, and communicate their workflows and processes, facilitating better decision-making, process optimization, and improved overall efficiency.

Applications and Benefits to Process Improvement Methodologies
Using Visio process mapping can be a valuable asset in your Six Sigma efforts by enhancing various phases of the Six Sigma methodology, which is focused on process improvement and reducing defects. Here’s how visual mapping can contribute:
- Define Phase:
- Process Understanding: Visio can help create detailed process maps that visually represent your current processes. This provides a clear understanding of how processes work, their inputs, outputs, and potential bottlenecks.
- Identify Key Inputs and Outputs: Visio diagrams can help identify critical process inputs and outputs, which are crucial for defining process performance metrics (Y and X factors) in Six Sigma projects.
- Measure Phase:
- Data Collection: Visio can be used to document data collection points within a process. This ensures that data is collected consistently and at the right stages, which is essential for accurate measurement.
- Process Variation Analysis: can help identify sources of process variation, aiding in the measurement and analysis of process performance.
- Analyze Phase:
- Root Cause Analysis: Visio maps can be annotated to highlight potential problem areas or bottlenecks within a process. This visual representation can assist in identifying the root causes of defects or process inefficiencies.
- Process Flow Analysis: helps identify areas where streamlining or improvements can be made.
- Improve Phase:
- Simulation: Some versions of Visio offer simulation capabilities. You can create “what-if” scenarios to test process improvements before implementing them, reducing the risk of unsuccessful changes.
- Optimization: Visio can help design optimized process flows and workflows by visualizing changes and improvements, making it easier to communicate these changes to the team.
- Control Phase:
- Standardization: Visio maps can serve as the basis for standard operating procedures (SOPs) and process documentation. They help ensure that the improved processes are consistently followed.
- Monitoring: Visio maps can include key performance indicators (KPIs) and control points, making it easier to monitor the effectiveness of the improvements made during the Six Sigma project.
- Communication and Training:
- Training Materials: Visio diagrams can be used to create training materials and presentations, making it easier to educate team members about process changes and improvements.
- Stakeholder Communication: Visio maps provide a visual and easily understandable way to communicate project progress and outcomes to stakeholders.
In summary, process mapping supports Six Sigma efforts by providing a visual representation of processes, aiding in data collection, analysis, and communication of process improvements. It helps teams identify areas for optimization, track progress, and maintain standardized processes, all of which are key aspects of the Six Sigma methodology.

How to Create a Process Flow Diagram in Visio?
Creating a Visio diagram involves several steps, and the specific steps may vary slightly depending on the version of Microsoft Visio you’re using.
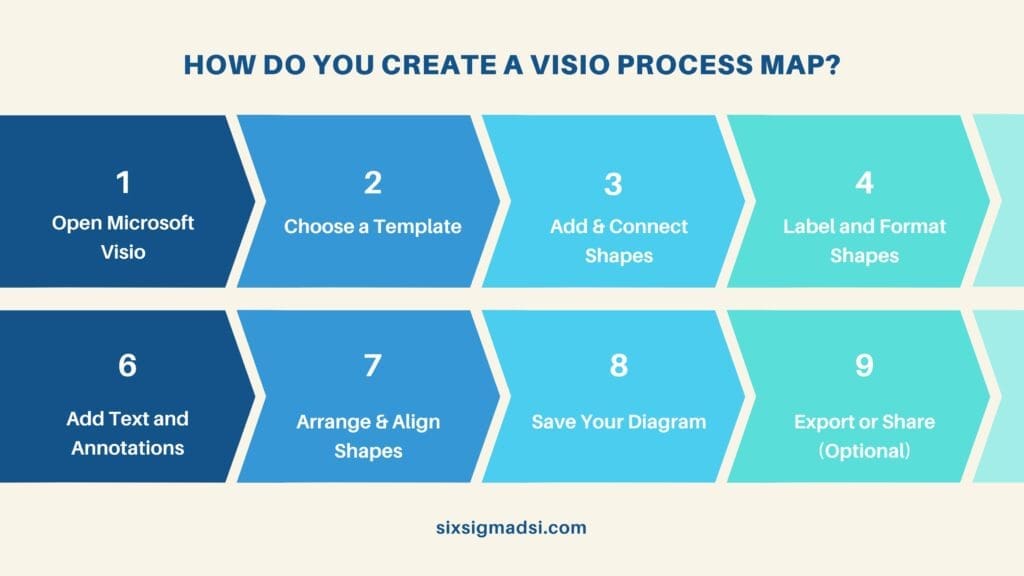
Here are the general steps to create a basic Visio diagram:
- Open the Software
- Choose a Template
- Add & Connect Shapes:
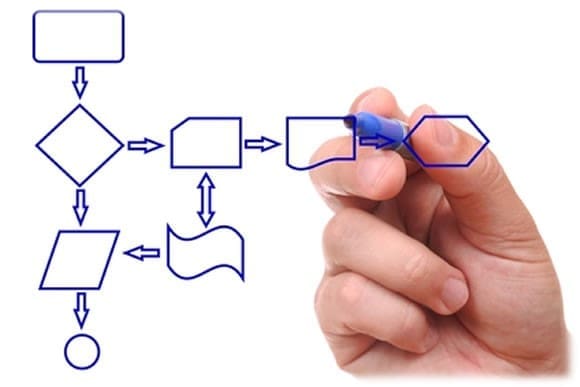
- Once you’ve selected a template, you’ll be presented with a blank canvas. Use the shape libraries on the left-hand side to drag and drop shapes onto the canvas. These shapes represent various elements in your diagram, such as rectangles for processes, diamonds for decisions, and arrows for connecting them.
- Use connector lines (usually arrows) to connect the shapes and show the flow of your process or information. Connectors are available in the shape of libraries.
- Label and Format Shapes:
- Double-click on shapes to add text and labels to them. You can also format shapes, change their colors, add gradients, and adjust line styles to make your diagram visually appealing and informative.
- Add Text and Annotations
- Arrange and Align Shapes
- Save Your Diagram
- Export or Share (Optional)
Visio offers a plethora of process diagram templates, broadly categorized into two main groups:
- General-Purpose Process Diagrams: When you need to create a process diagram without adhering to a specific methodology, Visio provides three versatile templates suitable for various purposes.
- Basic Flowchart: The Basic Flowchart template is adaptable for a wide array of business processes, with each step easily represented using uncomplicated geometric shapes.Cross-Functional Flowchart: Similar to the Basic Flowchart, the Cross-Functional Flowchart template includes an additional structural element—swimlanes—that depicts the responsible individuals or departments for each step. It employs the same shape stencil as the Basic Flowchart but integrates swimlanes for immediate use. Workflow Diagram: The Workflow Diagram serves as a versatile pictorial representation. It offers shapes pertinent to common business departments, objects, and stages. This template provides a more visual and representative approach to showcasing how a process transitions through different phases, making it an alternative to the Basic Flowchart.
- Click the File tab.
- Select New.
- Click Flowchart.
- Process Diagrams for Specific Methodologies: Methodology-based process diagrams offer more structured representations than their general-purpose counterparts, enabling the conveyance of detailed information. These diagrams often employ symbols with specific meanings or necessitate the inclusion of particular data with specific shapes to fully articulate the process. The guidelines for these diagrams are typically defined formally in specifications, many of which are accessible online. Please note that these diagrams are only supported in Visio Professional and Visio Plan 2.
This classification of templates caters to a wide range of needs, allowing you to select the most suitable template based on your specific requirements and the level of detail you aim to incorporate into your process diagrams.
Ready to take your process mapping to the next level with Visio?
Share your thoughts, questions, or experiences with process mapping in the comments below. We’d love to hear from you! Whether you’re a seasoned pro or just starting out your insights and questions can spark valuable discussions and help our community grow!


