
Bivariate analysis is the statistical examination of two variables simultaneously to determine whether a relationship exists between them, what direction that relationship takes, and how strong it is. In Six Sigma, bivariate analysis is a core Analyze phase tool. When a team suspects that a process input (X) drives a process output (Y), bivariate analysis answers the question with data: is the relationship real, is it linear, and is it strong enough to be useful for prediction and improvement?
Table of contents
Meaning of Bivariate analysis
Bivariate analysis is the statistical examination of the relationship between exactly two variables — an independent variable (X) and a dependent variable (Y). It determines whether a relationship exists, whether it is positive or negative, and how strong it is. The three main tools of bivariate analysis are scatter plots (visualizing the relationship), correlation analysis (quantifying the direction and strength), and regression analysis (modeling the relationship as a predictive equation).
In Six Sigma, bivariate analysis is used during the Analyze phase of DMAIC to confirm which process inputs significantly affect the process output.
Key Takeaways
- Bivariate analysis examines exactly two variables simultaneously. One variable is typically the independent variable (X) and the other is the dependent variable (Y).
- Bivariate analysis sits between univariate analysis (one variable) and multivariate analysis (three or more variables).
- The three main tools of bivariate analysis are scatter plots, correlation analysis, and simple linear regression — applied in that sequence in most Six Sigma Analyze phase investigations.
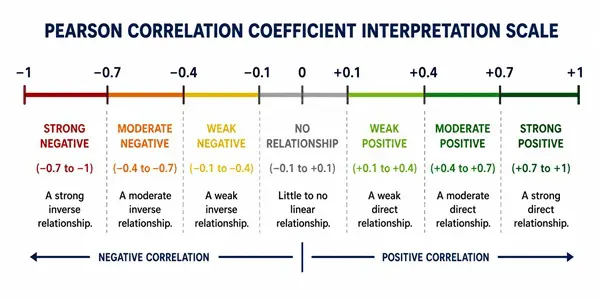
- The Pearson correlation coefficient (r) measures the direction and strength of a linear relationship between two continuous variables. It ranges from −1 to +1. A value of +1 means perfect positive linear correlation; −1 means perfect negative linear correlation; 0 means no linear relationship.
- Correlation does not equal causation. A strong correlation between X and Y does not prove X causes Y. Establishing causation requires process knowledge, subject matter expertise, and often designed experiments.
- In Six Sigma’s Analyze phase, bivariate analysis determines which Xs from the cause-and-effect matrix or fishbone diagram have a statistically significant and measurable relationship with the project Y.

Public, Onsite, Virtual, and Online Six Sigma Certification Training!
- We are accredited by the IASSC.
- Live Public Training at 52 Sites.
- Live Virtual Training.
- Onsite Training (at your organization).
- Interactive Online (self-paced) training,
What Is Bivariate Analysis?
Bivariate analysis means analyzing two variables at the same time. The prefix bi means two; variate refers to a variable. When a dataset contains measurements on two characteristics for the same set of subjects or process outputs, that dataset is bivariate data, and the analytical approach used to examine it is bivariate analysis.
The purpose of bivariate analysis is to answer a specific question: do these two variables move together in a predictable way? If they do, the next questions are: in which direction, and how reliably?
Also Read: Natural Variation
Bivariate vs. Univariate vs. Multivariate
Understanding where bivariate analysis fits in the landscape of statistical analysis clarifies when to use it:
| Analysis Type | Number of Variables | Primary Goal | Six Sigma Context |
| Univariate | One | Describe the distribution of a single variable (mean, spread, shape) | Measure phase baseline: what does my process output look like? |
| Bivariate | Two | Examine the relationship between one X and one Y | Analyze phase: does this specific X drive Y? |
| Multivariate | Three or more | Model the combined effect of multiple Xs on Y simultaneously | Analyze/Improve phase: which combination of Xs best predicts Y? |
Bivariate analysis is not the same as two-sample analysis. In two-sample analysis (such as a two-sample t-test), two independent groups are compared on the same single variable — for example, comparing the average cycle time from Shift A against the average cycle time from Shift B.
In bivariate analysis, two different variables are measured on the same observations — for example, measuring both cycle time and temperature for the same set of production runs and asking whether temperature predicts cycle time.
The Three Tools of Bivariate Analysis
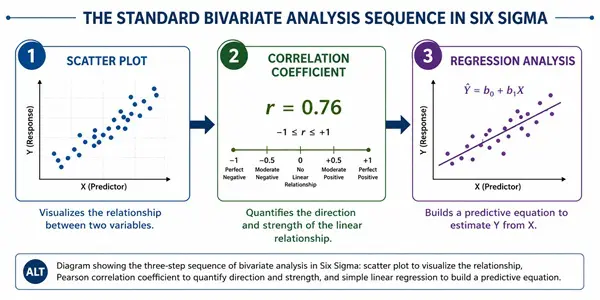
Bivariate analysis in a Six Sigma project follows a standard three-step sequence, each step building on the one before.
1. Scatter Plot: Visualize the Relationship First
A scatter plot (also called a scatter diagram) is always the first step in bivariate analysis. It plots each paired observation as a single point: X on the horizontal axis, Y on the vertical axis. The pattern formed by all the points reveals whether a relationship exists and what form it takes before any calculations begin.
The key patterns to look for in a scatter plot:
Positive linear relationship: Points form an upward slope from left to right. As X increases, Y tends to increase. Example: as furnace temperature increases, material hardness increases.
Negative linear relationship: Points form a downward slope from left to right. As X increases, Y tends to decrease. Example: as machine speed increases, dimensional accuracy decreases.
No relationship: Points scatter randomly with no discernible pattern. X provides no predictive information about Y within the range studied.
Nonlinear relationship: Points follow a curve rather than a straight line. A linear correlation coefficient will understate or miss this relationship. Alternative modeling approaches (polynomial regression, transformation) may be needed.
A critical rule: always examine the scatter plot before calculating any correlation coefficient. Two datasets can produce the same Pearson r value while having completely different underlying patterns.
Anscombe’s quartet — four datasets constructed in 1973 by statistician Francis Anscombe — famously demonstrated that datasets with identical means, variances, and correlation coefficients can look completely different when plotted, including one dataset with a perfect nonlinear curve and another dominated by a single outlier. No summary statistic substitutes for visual inspection of the data.
2. Correlation Analysis: Quantify Direction and Strength
Once the scatter plot confirms that a linear relationship appears plausible, correlation analysis quantifies it.
The Pearson correlation coefficient (written as r) is the standard measure of linear correlation between two continuous variables. It is calculated from the paired data and produces a single number between −1 and +1.
Interpreting the Pearson correlation coefficient:
| r Value | Interpretation |
| +1.0 | Perfect positive linear correlation. As X increases, Y increases by a perfectly proportional amount. All points fall exactly on an upward-sloping line. |
| +0.7 to +0.9 | Strong positive correlation. Points cluster closely around an upward-sloping line with some scatter. |
| +0.4 to +0.6 | Moderate positive correlation. A positive trend is visible but scatter is substantial. |
| +0.1 to +0.3 | Weak positive correlation. A slight upward trend exists but prediction would be unreliable. |
| 0 | No linear correlation. X provides no linear predictive value for Y within the range studied. |
| −0.1 to −0.3 | Weak negative correlation. A slight downward trend exists. |
| −0.4 to −0.6 | Moderate negative correlation. |
| −0.7 to −0.9 | Strong negative correlation. Points cluster closely around a downward-sloping line. |
| −1.0 | Perfect negative linear correlation. As X increases, Y decreases by a perfectly proportional amount. All points fall exactly on a downward-sloping line. |
The sign of r tells you the direction: positive means X and Y increase together; negative means as one increases the other decreases. The magnitude of r (ignoring the sign) tells you the strength: values closer to 1.0 (in either direction) indicate stronger linear relationships.
What r does not tell you: Pearson r measures only linear relationships. A strong nonlinear relationship can produce an r close to zero because the relationship does not follow a straight-line pattern. This is another reason the scatter plot must come first — a near-zero r does not guarantee no relationship exists.
3. Simple Linear Regression: Model and Predict
If the scatter plot shows a plausible linear relationship and the correlation coefficient confirms it is strong enough to be meaningful, the next step is simple linear regression: building a mathematical equation that models the relationship and allows prediction.
The simple linear regression equation takes the form:
Y = b₀ + b₁X
Where:
- b₀ is the y-intercept (the predicted value of Y when X equals zero)
- b₁ is the slope (the average change in Y for each one-unit increase in X)
The equation uses the least squares method to find the line that minimizes the sum of squared differences between actual observed Y values and the Y values predicted by the line.
Regression goes beyond correlation in two important ways. First, it produces a predictive equation — not just “these variables are related” but “for every 1°C increase in temperature, yield increases by 0.8%.” Second, it provides significance testing through the p-value for the slope: if the p-value is below 0.05, the linear relationship is statistically significant and not attributable to random chance in the sample.
Correlation vs. Causation: A Critical Distinction
Bivariate analysis can reveal and quantify a relationship between X and Y. It cannot prove that X causes Y. This distinction is not a technicality — it is practically important in Six Sigma projects where conclusions drive real process changes.
Two variables can be strongly correlated for several reasons other than direct causation:
Reverse causation: Y may cause X rather than X causing Y. A strong correlation between machine breakdowns and late deliveries does not tell you which causes which.
Common cause: Both X and Y may be driven by a third, unmeasured variable Z. Ice cream sales and drowning incidents are famously correlated in summer data — not because ice cream causes drowning, but because warm weather independently increases both.
Coincidental correlation: With enough variables measured, some will correlate purely by chance, especially in small samples.
In Six Sigma, establishing causation requires combining bivariate analysis with process knowledge (does a credible mechanism exist?), designed experiments (does changing X systematically cause Y to change?), and subject matter expertise. A strong correlation from a scatter plot and regression analysis is evidence that warrants further investigation, not a conclusion that the investigation is complete.
Also Read: Correlation Coefficient
Bivariate Analysis in the Six Sigma DMAIC Framework
Bivariate analysis tools — scatter plots, correlation, and regression — appear primarily in the Analyze phase of DMAIC, though they connect to decisions made in the Measure phase and influence actions taken in the Improve phase.
| DMAIC Phase | Role of Bivariate Analysis |
| Define | The project Y (output metric) is defined. Potential X variables are often listed in the project charter’s “input variables” section. |
| Measure | Paired data on potential X and Y variables is collected. The data collection plan should specify how X and Y will be measured simultaneously for the same units or time periods. |
| Analyze | Scatter plots are built for each priority X-Y pair. Pearson r is calculated. Regression models are built for Xs showing a strong linear relationship with Y. The goal is to confirm which specific Xs are statistically significant drivers of Y, narrowing the original cause list to the confirmed vital few. |
| Improve | Regression equations from the Analyze phase are used to predict what value of X is needed to achieve the desired Y target. Pilot experiments test whether adjusting X actually moves Y in the predicted direction. |
| Control | Xs confirmed to drive Y are monitored through control charts. The regression relationship informs what X value to maintain to keep Y within specification. |
In practice, bivariate analysis in the Analyze phase works through a sequence: the team’s cause-and-effect matrix or fishbone diagram produces a list of potential X variables. Priority Xs are selected based on team knowledge and C&E matrix scores.
Bivariate analysis (scatter plot → correlation → regression) is then applied to each priority X-Y pair to determine which ones are statistically confirmed. Xs with strong correlation and significant regression slopes become the focus of the Improve phase.
How to Perform Bivariate Analysis in Minitab
Minitab is the standard statistical software used in Six Sigma Green Belt and Black Belt training. All three bivariate analysis tools are available through straightforward menu paths.
Scatter Plot: Stat > Basic Statistics > Correlation or Graph > Scatterplot > Simple. Enter the Y variable in the Y column and the X variable in the X column. Review the resulting plot for pattern, direction, outliers, and nonlinearity.
Pearson Correlation Coefficient: Stat > Basic Statistics > Correlation. Select both variables. Minitab outputs the Pearson r and a p-value testing whether the correlation is significantly different from zero. A p-value below 0.05 confirms the correlation is statistically significant.
Simple Linear Regression: Stat > Regression > Regression > Fit Regression Model. Assign the Y variable to Responses and the X variable to Continuous Predictors. Select “Four in one” residual plots under Graphs. Review the regression equation, R-squared, slope p-value, and residual plots together before drawing conclusions.
Frequently Asked Questions: Bivariate Analysis
Q: What is bivariate analysis in simple terms?
A: Bivariate analysis is the examination of two variables together to determine whether they are related, in which direction they move relative to each other, and how strongly. It uses tools like scatter plots to visualize the relationship, correlation coefficients to quantify it, and regression analysis to model it as a predictive equation. In Six Sigma, it is used primarily in the Analyze phase to confirm which process inputs (Xs) drive the process output (Y).
Q: What is the difference between univariate, bivariate, and multivariate analysis?
A: Univariate analysis examines one variable at a time, typically to describe its distribution using measures like mean, standard deviation, and histogram shape.
Bivariate analysis examines two variables simultaneously to determine whether they are related. Multivariate analysis examines three or more variables together to model their combined effect on an outcome.
In Six Sigma, univariate analysis describes the baseline in the Measure phase; bivariate analysis identifies individual significant Xs in the Analyze phase; and multivariate analysis builds the full predictive model using all confirmed significant Xs.
Q: What does a Pearson correlation coefficient of −1 mean?
A: A Pearson correlation coefficient of −1 indicates a perfect negative linear relationship between the two variables. As one variable increases, the other decreases by a perfectly proportional amount, and every data point falls exactly on a downward-sloping straight line. It does not mean the variables are “in sync” — that would imply positive agreement. A value of −1 means they move in exactly opposite directions with perfect consistency.
Q: How is bivariate analysis different from two-sample analysis?
A: Two-sample analysis (such as a two-sample t-test) compares two independent groups on the same single variable — for example, comparing average cycle time between two shifts. Bivariate analysis examines two different variables measured on the same observations — for example, measuring both cycle time and temperature for the same production runs and asking whether temperature predicts cycle time. Two-sample analysis is a group comparison; bivariate analysis is a relationship investigation.
Q: Does a high correlation between two variables prove that one causes the other?
A: No. Correlation measures the strength and direction of a statistical association between two variables, but it cannot establish causation.
A strong correlation may exist because X causes Y, because Y causes X, because a third variable drives both, or by coincidence in the sample. In Six Sigma, establishing causation requires combining the bivariate analysis finding with process knowledge, subject matter expertise, and typically a designed experiment that deliberately changes X and observes the effect on Y.
Q: Where does bivariate analysis fit in a DMAIC project?
A: Bivariate analysis fits primarily in the Analyze phase of DMAIC. After the Measure phase establishes baseline data on the project Y and collects measurements on potential X variables, the Analyze phase uses scatter plots, correlation analysis, and simple linear regression to confirm which specific Xs have a statistically significant linear relationship with Y.
The Xs confirmed through bivariate analysis become the focus of the Improve phase, where they are adjusted to move Y toward the target value.
Q: What is the correct sequence for bivariate analysis tools?
A: The correct sequence is:
(1) plot the scatter diagram first to visually inspect the form, direction, and strength of the relationship and to check for outliers and nonlinearity;
(2) calculate the Pearson correlation coefficient to quantify the direction and strength of the linear relationship;
(3) build a simple linear regression model if the scatter plot and correlation confirm a plausible, strong linear relationship, to produce a predictive equation and test whether the slope is statistically significant.
Skipping the scatter plot and going directly to the correlation coefficient can lead to missing nonlinear relationships or outlier distortions that the number alone would not reveal.
Bivariate Analysis Training in Six Sigma
Scatter plot interpretation, Pearson correlation, and simple linear regression — the complete bivariate analysis toolkit — are core Analyze phase competencies tested on the IASSC Green Belt and Black Belt certification exams.
Understanding not just how to calculate these statistics but how to correctly interpret them, and specifically how to avoid the correlation-causation error, separates practitioners who use these tools effectively from those who draw premature conclusions from them.
At Six Sigma Development Solutions Inc, bivariate analysis is taught as an applied Analyze phase skill in our Green Belt and Black Belt training programs. Practitioners work through real X-Y datasets, build scatter plots, interpret correlation coefficients correctly, and use regression models to set Improve phase targets.
We offer Six Sigma training in three formats:
- Onsite training — Delivered at your facility, using your actual process data to build and interpret scatter plots and regression models in the Analyze phase curriculum.
- Live virtual training — Instructor-led sessions delivered online, with real-time Minitab exercises covering scatter plot analysis, Pearson r, and simple linear regression interpretation.
- Online training — Self-paced Green Belt and Black Belt certification programs covering all IASSC-testable bivariate and multivariate statistical content.
Explore our Six Sigma training programs or contact our team to find the right program for your certification goals.
About Six Sigma Development Solutions, Inc.
Six Sigma Development Solutions, Inc. offers onsite, public, and virtual Lean Six Sigma certification training. We are an Accredited Training Organization by the IASSC (International Association of Six Sigma Certification). We offer Lean Six Sigma Green Belt, Black Belt, and Yellow Belt, as well as LEAN certifications.
Book a Call and Let us know how we can help meet your training needs.


