

Bow tie analysis represents a powerful visual risk assessment methodology that helps organizations identify, analyze, and manage potential hazards systematically. This comprehensive approach combines cause-and-effect analysis with consequence evaluation, creating a distinctive diagram that resembles a bow tie when viewed graphically.
The bowtie model serves as both a qualitative and quantitative risk assessment tool, enabling risk managers to understand how preventive measures can reduce the likelihood of hazardous events while protective measures can minimize their consequences. Organizations across industries rely on this bow tie method to enhance their risk management frameworks and improve overall safety performance.
Table of contents
What is Bow Tie Analysis?
Bow tie analysis is a risk management tool that visually maps out risks, their causes, consequences, and the controls in place to manage them. The bowtie diagram gets its name from its distinctive shape, resembling a bow tie. At its core is the top event, the moment when control over a hazard is lost, potentially leading to undesirable outcomes.
On the left side, you’ll find the threats or causes that could trigger this event, while the right side shows the consequences if the event occurs. Barriers, or controls, are placed on both sides to prevent or mitigate the risk.
This method is widely used across industries like oil and gas, aviation, healthcare, and cybersecurity because it simplifies complex risks into a single, easy-to-understand picture. Unlike traditional risk assessment methods, the bow tie method balances proactive (preventive) and reactive (mitigative) strategies, making it a versatile tool for any organization.

Public, Onsite, Virtual, and Online Six Sigma Certification Training!
- We are accredited by the IASSC.
- Live Public Training at 52 Sites.
- Live Virtual Training.
- Onsite Training (at your organization).
- Interactive Online (self-paced) training,
Understanding the Bowtie Model Structure
The bow tie diagram consists of three fundamental components that work together to provide a complete risk picture. At the center lies the top event or hazard, which represents the critical incident that organizations want to prevent or control.
On the left side of the bowtie diagram, threat events and their associated causes branch out like a fault tree, showing all potential pathways that could lead to the central hazard. Meanwhile, the right side displays consequence events that might occur if the top event materializes, resembling an event tree structure.
This dual-sided approach makes the bowtie risk assessment particularly effective because it addresses both proactive prevention and reactive protection strategies. Furthermore, the visual nature of the risk diagram makes it easier for stakeholders to understand complex risk scenarios and their interconnections.
Why Use Bow Tie Analysis for Risk Management?
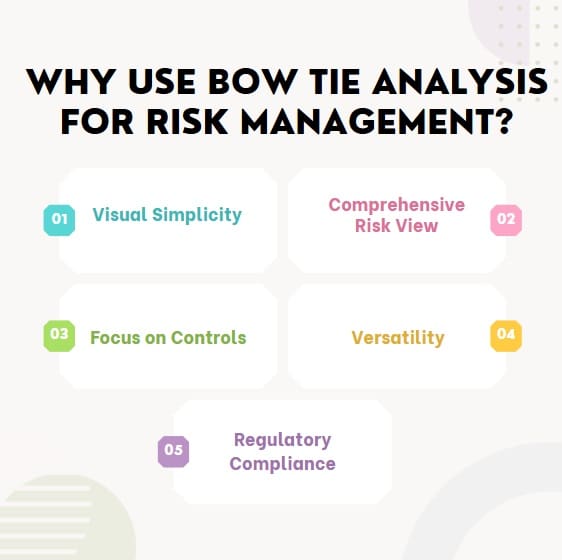
The bowtie risk assessment shines because of its clarity and practicality. Here’s why businesses love it:
- Visual Simplicity: The bow tie diagram offers a clear snapshot of risks, making it easy to communicate with stakeholders, from frontline workers to executives.
- Comprehensive Risk View: It captures both the causes and consequences of a risk, helping teams understand the full scope of potential issues.
- Focus on Controls: By highlighting preventive and mitigative barriers, it ensures organizations address risks at every stage.
- Versatility: From small businesses to large enterprises, the bow tie model adapts to various industries and risk scenarios.
- Regulatory Compliance: It helps organizations meet safety and compliance standards, especially in high-risk sectors like energy or transportation.
By using the bowtie method, companies can reduce downtime, prevent incidents, and build a safer, more resilient operation.
How Does a Bow Tie Diagram Work?
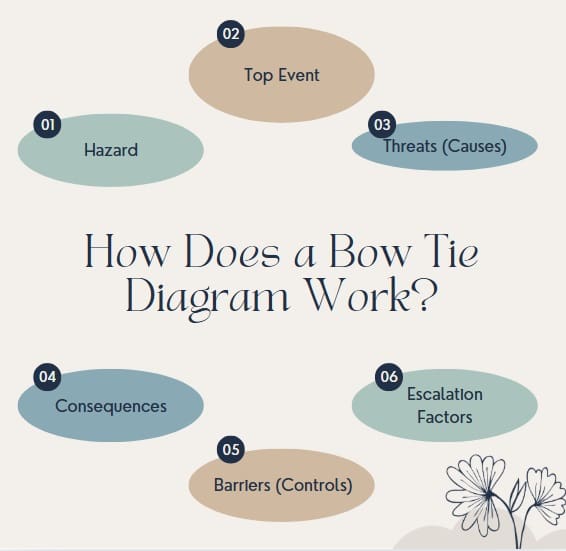
The bow tie diagram is built around a structured process that breaks down risks into manageable components. Here’s a closer look at its key elements:
1. Hazard
Every bow tie starts with a hazard, something with the potential to cause harm. For example, in a chemical plant, the hazard might be “flammable liquids.” In cybersecurity, it could be “sensitive data exposure.”
2. Top Event
The top event is the critical moment when control over the hazard is lost, but no damage has occurred yet. For instance, a top event might be “uncontrolled release of flammable liquids” or “unauthorized data access.”
3. Threats (Causes)
On the left side of the diagram, you list the threats or causes that could lead to the top event. These might include equipment failure, human error, or external factors like weather conditions.
4. Consequences
On the right side, you outline the consequences if the top event occurs. These could range from financial losses and reputational damage to injuries or environmental harm.
5. Barriers (Controls)
Barriers are the preventive and mitigative controls that stop threats from causing the top event or reduce the impact of consequences. Preventive barriers, like regular equipment maintenance, sit on the left, while mitigative barriers, like emergency response plans, sit on the right.
6. Escalation Factors
Sometimes, barriers fail due to escalation factors, such as poor maintenance or inadequate training. Identifying these helps strengthen controls.
By mapping these elements, the bowtie chart provides a clear path from risk identification to mitigation, making it easier to prioritize resources.
Also Read: What is Cluster Analysis?
How to Create a Bow Tie Diagram?
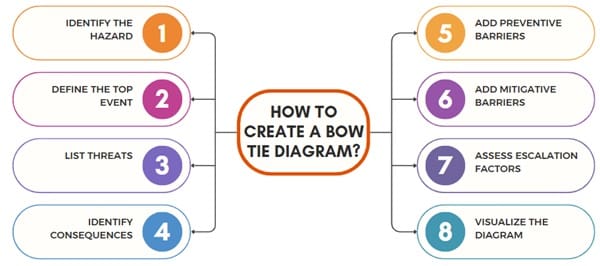
Creating a bow tie risk assessment is straightforward. Follow these steps to build your own diagram:
Step 1: Identify the Hazard
Start by pinpointing the hazard you want to analyze. Be specific—for example, “handling hazardous chemicals” rather than just “chemicals.”
Step 2: Define the Top Event
Determine the moment when control over the hazard is lost. For example, “chemical spill” or “system outage.” Keep it precise to focus the analysis.
Step 3: List Threats
Brainstorm all possible causes that could trigger the top event. Involve a diverse team to ensure you cover every angle, from equipment malfunctions to human errors.
Step 4: Identify Consequences
Outline what could happen if the top event occurs. Consider impacts like financial loss, safety risks, or regulatory penalties.
Step 5: Add Preventive Barriers
List controls that prevent the top event from happening. Examples include regular inspections, training programs, or safety protocols.
Step 6: Add Mitigative Barriers
Identify measures that reduce the impact of consequences, such as emergency response plans or backup systems.
Step 7: Assess Escalation Factors
Consider what could weaken your barriers, like outdated equipment or insufficient training, and add secondary controls to address these.
Step 8: Visualize the Diagram
Use a bow tie diagram template to map everything out. Tools like Excel, PowerPoint, or specialized software like BowTieXP can help create a professional diagram.
Bow Tie Analysis Example
Let’s walk through a real-world bowtie analysis example to see how it works. Imagine a company assessing the risk of a “Data Center Outage Greater than 24 Hours.”
- Hazard: Data center operations.
- Top Event: Data center outage lasting over 24 hours.
- Threats: Cyberattack, power failure, flooding, or equipment failure.
- Consequences: Customer downtime, financial loss, reputational damage.
- Preventive Barriers: Firewalls, backup power systems, flood defenses, regular maintenance.
- Mitigative Barriers: Disaster recovery plans, customer communication protocols, backup data centers.
- Escalation Factors: Inadequate cybersecurity training or outdated backup systems.
By mapping this in a bowtie diagram, the company can see where to strengthen controls, such as improving cybersecurity training or upgrading backup systems, to reduce the risk of an outage.
Benefits of Bow Tie Analysis in Risk Management
The bow tie risk analysis offers several advantages that make it a go-to tool for organizations:
- Improved Communication: Its visual format makes complex risks easy to explain to stakeholders, from employees to regulators.
- Holistic Risk Management: It covers both proactive and reactive strategies, ensuring no aspect of risk is overlooked.
- Control Gap Identification: It highlights weaknesses in current controls, helping prioritize improvements.
- Scalability: Whether you’re managing a single project or enterprise-wide risks, the bowtie method adapts to your needs.
- Enhanced Decision-Making: By clearly showing risks and controls, it helps leaders allocate resources effectively.
These benefits make bow tie analysis a must-have for organizations looking to stay ahead of risks.
Industries Using Bow Tie Analysis
The bowtie risk management approach is popular across various sectors due to its flexibility. Here are a few industries where it shines:
- Oil and Gas: To manage risks like explosions or spills.
- Aviation: To assess risks like equipment failure or human error.
- Healthcare: To prevent patient safety incidents.
- Cybersecurity: To protect against data breaches or system failures.
- Construction: To address workplace hazards like falls or equipment accidents.
No matter the industry, the bow tie model provides a clear framework for managing risks effectively.
Tools and Templates
Creating a bow tie diagram doesn’t require fancy software, but tools can make the process easier. Here are some options:
- Excel and PowerPoint: Simple and accessible, these tools are great for creating manual diagrams. Download our free bowtie diagram template [internal link suggestion: /bowtie-diagram-template-download] to get started.
- BowTieXP: A specialized software for creating detailed, dynamic diagrams.
- Presight OpenRisk: Offers real-time visualization and data integration for complex risks.
- QI Macros: An Excel add-on with ready-made bow tie templates.
Also Read: What is Fault Tree Analysis?
Challenges and Limitations
While powerful, the bowtie model has some limitations:
- Static Nature: Traditional diagrams may become outdated without regular updates.
- Subjectivity: Defining the top event or assessing control effectiveness can be subjective.
- Complexity: In highly complex systems, diagrams can become cluttered, reducing clarity.
To overcome these, use dynamic software tools, involve diverse teams, and review diagrams regularly to reflect changes in your risk landscape.
Best Practices for Effective Bow Tie Analysis
To maximize the bow tie risk management approach, follow these tips:
- Involve Experts: Include team members from different departments to ensure a comprehensive analysis.
- Be Specific: Avoid vague terms like “human error” and focus on precise threats and consequences.
- Update Regularly: Revisit diagrams to account for new risks or changes in operations.
- Use Data: Base your analysis on reliable data to improve accuracy.
- Integrate with Other Tools: Combine bow tie analysis with methods like Fault Tree Analysis or HAZOP for deeper insights.
By following these practices, you’ll create robust diagrams that drive meaningful risk management.
Frequently Asked Questions on Bow-tie Analysis
What is bow tie analysis?
Bow tie analysis is a risk management tool that visually maps out a hazard, its causes, consequences, and the controls to prevent or mitigate it. The diagram, shaped like a bow tie, centers on a top event, with threats on the left and consequences on the right, connected by preventive and mitigative barriers.
How do you create a bow tie diagram?
To create a bow tie diagram, identify the hazard, define the top event, list threats and consequences, and add preventive and mitigative barriers. Use a template or software like Excel, PowerPoint, or BowTieXP to visualize the diagram.
What industries use bow tie risk assessment?
Bow tie analysis is used in industries like oil and gas, aviation, healthcare, cybersecurity, and construction to manage risks such as equipment failures, safety incidents, or data breaches.
What are the benefits of the bowtie method?
The bowtie method offers clear visualization, comprehensive risk assessment, improved communication, and the ability to identify control gaps, making it easier to manage risks effectively.
Where can I find a bow tie diagram template?
You can find free bow tie diagram templates in Excel or PowerPoint online.
Also See: Input Map Template
Final Words
Bow tie analysis is a game-changer for organizations looking to simplify and strengthen their risk management. By providing a clear, visual way to map out risks, causes, consequences, and controls, the bowtie model empowers teams to make informed decisions and prevent costly incidents. Whether you’re in oil and gas, healthcare, or cybersecurity, this method adapts to your needs.

About Six Sigma Development Solutions, Inc.
Six Sigma Development Solutions, Inc. offers onsite, public, and virtual Lean Six Sigma certification training. We are an Accredited Training Organization by the IASSC (International Association of Six Sigma Certification). We offer Lean Six Sigma Green Belt, Black Belt, and Yellow Belt, as well as LEAN certifications.
Book a Call and Let us know how we can help meet your training needs.


